A single drone flight over a 200-acre agricultural parcel can now generate data that would have taken a team of agronomists weeks to collect on foot — and that data is fundamentally changing how property valuations are prepared. The application of multispectral sensors in drone surveys: revealing soil health and vegetation for 2026 property valuations has moved from experimental technology to a credible, commercially adopted practice that RICS-accredited surveyors and land agents are increasingly expected to understand.
This article examines how multi-sensor drone arrays capture non-topographic data — soil composition, moisture levels, vegetation stress, and nutrient distribution — and how that information is being integrated into formal valuation reports for agricultural land and development parcels.
Key Takeaways
- Multispectral drone sensors capture data across multiple light wavelengths, revealing soil and vegetation conditions invisible to standard cameras.
- Vegetation indices such as NDVI, NDRE, and NDWI provide quantifiable, comparable metrics that directly support land valuation arguments.
- Soil analysis derived from multispectral imagery can identify nitrogen, phosphorus, potassium, pH, and organic matter variability across a site.
- For agricultural and development parcels, this data adds a measurable, evidence-based layer to formal RICS valuations.
- Early adoption of this technology in 2026 gives surveyors a competitive advantage in preparing defensible, high-detail valuation reports.
What Multispectral Sensors Actually Measure
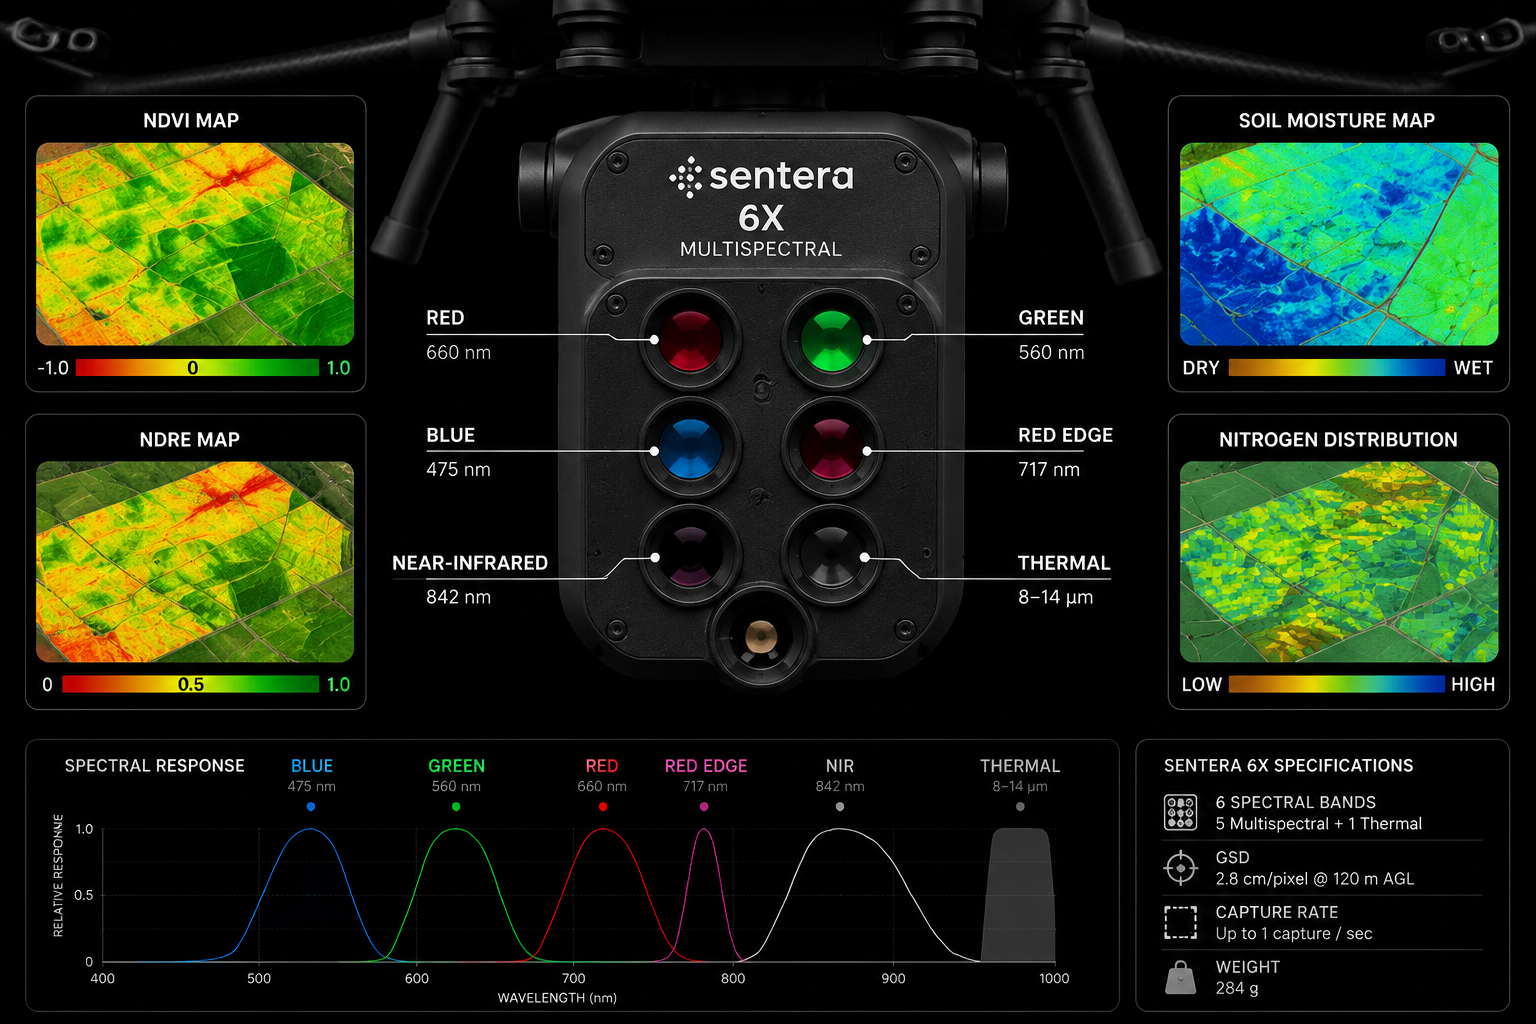
Standard RGB cameras capture the three wavelengths visible to the human eye: red, green, and blue. Multispectral sensors go further, recording reflectance across additional bands that the human eye cannot detect. The most commonly used bands in land survey applications include:
| Band | Wavelength Range | Primary Application |
|---|---|---|
| Red | 620-700 nm | Chlorophyll absorption, crop stress |
| Green | 520-600 nm | Plant biomass, general health |
| Red Edge | 700-730 nm | Early stress detection, nitrogen status |
| Near-Infrared (NIR) | 700-1100 nm | Vegetation density, water content |
| Thermal Infrared | 8,000-14,000 nm | Soil moisture, irrigation mapping |
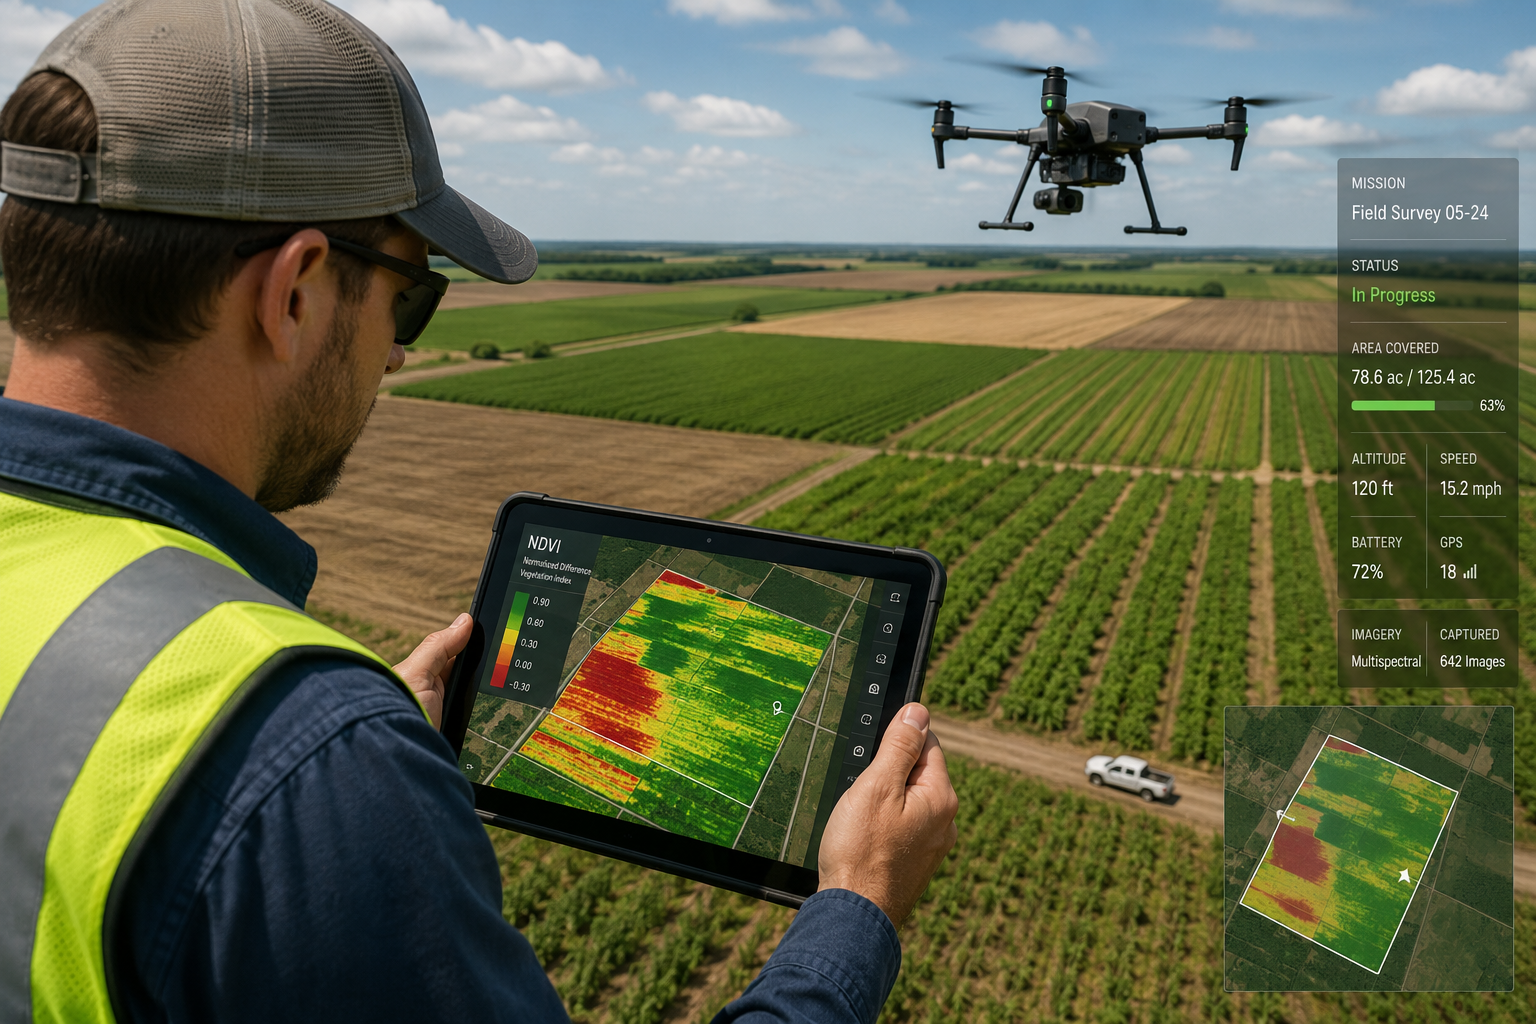
Advanced systems such as the Sentera 6X capture six discrete spectral bands simultaneously, including Red Edge and Near-Infrared, enabling the calculation of NDVI (Normalized Difference Vegetation Index), NDRE (Normalized Difference Red Edge), and a range of other vegetation indices [2]. Paired with heavy-lift commercial drones, a single mission can cover hundreds of acres while delivering calibrated, agronomically actionable data.
Why does this matter for property valuation? Because the condition of soil and vegetation is not merely an agricultural concern — it is a direct determinant of land value, development potential, and risk exposure.
Vegetation Indices Explained
The most widely cited index is NDVI, which compares near-infrared reflectance against red reflectance to produce a score between -1 and +1. Healthy, dense vegetation scores close to +1; bare soil and stressed crops score near 0 or below. NDRE is particularly sensitive to early-stage stress and nitrogen deficiency, often detecting problems weeks before visible symptoms appear [1].
Other indices relevant to property surveys include:
- NDWI (Normalized Difference Water Index) — assesses soil and canopy moisture
- GNDVI (Green NDVI) — sensitive to chlorophyll concentration
- SAVI (Soil-Adjusted Vegetation Index) — corrects for soil background in sparse vegetation areas [7]
Each index produces a georeferenced map that can be overlaid onto cadastral boundaries, drainage plans, and topographic surveys — creating a multi-layered evidence base for a valuation report.
How Soil Analysis Works Through Multispectral Drone Surveys
The connection between spectral reflectance and soil health is well established in precision agriculture, but its application to property valuation is newer and more nuanced. When multispectral UAVs collect images across multiple wavelengths, the data reveals not just what is growing on the land, but what conditions exist beneath the surface [3].
Combining multispectral satellite imagery, topographic data, and physics-informed modelling allows surveyors and agronomists to infer soil properties including:
- Nitrogen, phosphorus, and potassium (NPK) levels
- Soil pH and cation exchange capacity
- Organic matter content
- Soil moisture distribution
- Compaction zones and drainage anomalies [5]
This produces high-resolution nutrient maps that reveal variability across a parcel — variability that traditional spot-sampling methods routinely miss. A field that appears uniform to the naked eye may contain significant variation in productive capacity, and that variation has a direct bearing on its market value.
"Multispectral surveys can detect sub-surface features with archaeological potential, even on sites hidden beneath crops — demonstrating that the data extends well beyond surface-level assessment." [3]
Soil Moisture and Drainage Assessment
One of the most practically useful outputs for property valuations is the NDWI moisture map. By identifying areas of persistent waterlogging, poor drainage, or irrigation deficiency, this map provides objective evidence of conditions that affect both agricultural yield and development feasibility.
For sites being assessed for potential residential or commercial development, a drainage assessment informed by multispectral data can support or challenge planning assumptions. This is particularly relevant when combined with a formal drainage survey or subsidence survey, where soil moisture patterns may indicate ground movement risk.
Sub-Surface Feature Detection
Multispectral sensors also enable indirect soil analysis through the study of vegetation covering it. By recording electromagnetic reflectance across different bands, these sensors provide information about vegetation health that can indicate sub-surface features — including archaeological remains, buried infrastructure, and soil type boundaries [8]. For development land, identifying these features before purchase or planning application can prevent costly surprises.
Integrating Multispectral Data into 2026 Property Valuations
The practical question for surveyors is not whether this technology works — the evidence base is substantial — but how to integrate it meaningfully into a formal valuation report. The answer depends on the type of property and the purpose of the valuation.
Agricultural Land Valuations
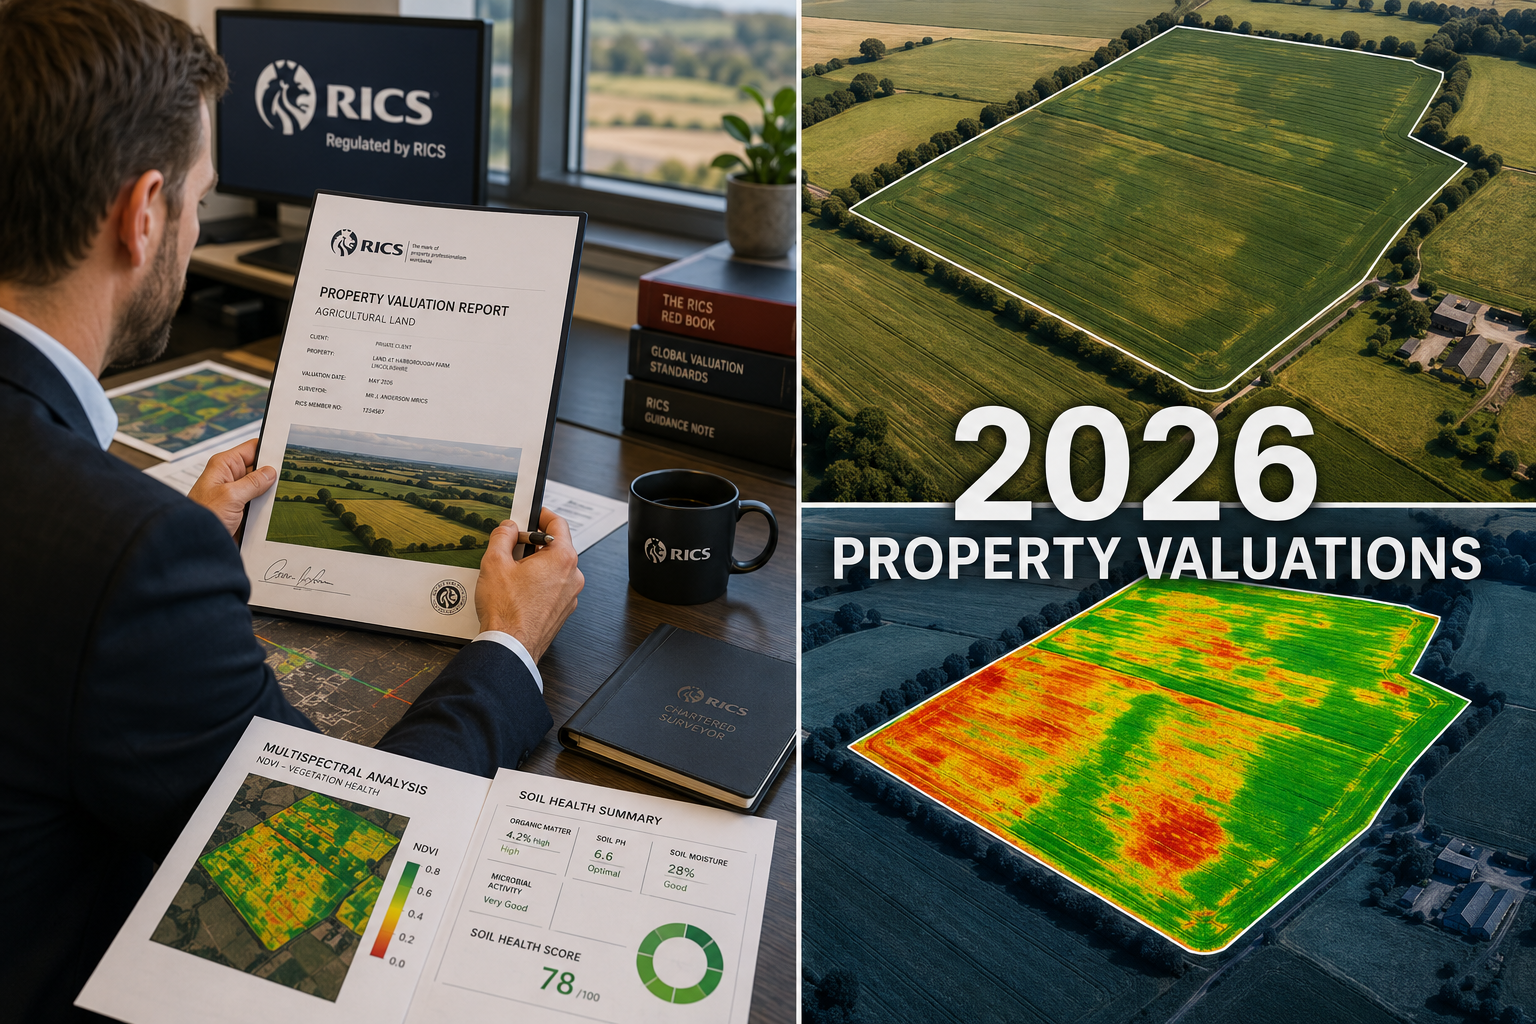
For agricultural parcels, multispectral drone data provides direct, quantifiable evidence of productive capacity. A parcel with consistently high NDVI scores across multiple growing seasons, combined with favourable NPK distribution maps, presents a stronger case for a premium valuation than one with patchy vegetation indices and evidence of nutrient depletion.
Surveyors preparing a Red Book valuation for agricultural land in 2026 can use multispectral outputs as supporting evidence within the comparable analysis section, particularly when justifying yield adjustments or condition-based discounts.
Key data points to include in the valuation report:
- NDVI map with seasonal comparison (minimum two growing seasons)
- NDRE map highlighting nitrogen status across field zones
- Soil moisture distribution map
- Nutrient variability map (NPK and pH)
- Percentage of land classified as high, medium, or low productivity
Development Land Valuations
For sites being assessed for development, multispectral data serves a different but equally important function. It provides objective evidence of:
- Contamination risk indicators — anomalous spectral signatures can suggest areas of chemical stress in vegetation, warranting further investigation
- Drainage and flood risk — NDWI maps identify persistent wet areas that may affect foundation design or planning viability
- Ecological constraints — vegetation health maps can identify habitats of potential value, relevant to planning conditions and biodiversity net gain requirements
When preparing a building survey or commercial building survey for a site with significant external land, integrating multispectral outputs adds a layer of due diligence that is increasingly expected by sophisticated buyers and lenders.
Cost-Effectiveness in 2026
A concern often raised about advanced sensor technology is cost. Recent research has demonstrated that RGB-based vegetation indices — derived from standard cameras — can offer performance comparable to more expensive multispectral indices for certain large-scale monitoring applications [4]. This finding is significant because it suggests that even where full multispectral capability is not deployed, meaningful vegetation data can still be extracted from standard drone imagery.
However, for formal valuation purposes where precision and defensibility matter, calibrated multispectral sensors remain the preferred tool. The cost per acre has fallen substantially as the technology has matured, and the data processing services now available — including advanced multispectral UAV data processing that provides insights into vegetation health, soil moisture, material properties, and structural conditions [9] — make the workflow increasingly accessible to smaller surveying practices.
Practical Workflow: From Flight to Valuation Report
Understanding the end-to-end process helps surveyors commission and interpret multispectral surveys effectively.
Step 1 — Mission Planning
Define the survey area, flight altitude, and required ground sampling distance (GSD). For most agricultural valuation purposes, a GSD of 5-10 cm per pixel is sufficient.
Step 2 — Calibration
Before and after each flight, the sensor is calibrated against a reflectance panel. This ensures that spectral values are absolute rather than relative, allowing comparison across different dates and sites.
Step 3 — Data Capture
The drone flies a pre-programmed grid pattern, capturing overlapping multispectral images. Environmental monitoring applications may also include wetland surveys, green roof inspections, and soil moisture assessments in a single mission [7].
Step 4 — Processing
Images are stitched into orthomosaics and processed to generate index maps. Advanced processing can infer soil properties such as nitrogen, phosphorus, potassium, pH, soil organic matter, and cation exchange capacity from the combined spectral and topographic dataset [5].
Step 5 — Interpretation and Reporting
Processed maps are interpreted by an agronomist or suitably qualified surveyor and translated into valuation-relevant findings. Raw index scores are less useful than contextualised commentary — a NDVI of 0.6 means something different on a clay-heavy arable field in February than on a market garden in July.
Step 6 — Integration with the Valuation Report
Findings are incorporated as a technical appendix to the valuation, with summary conclusions referenced in the main body. For a formal RICS valuation, the surveyor must ensure that all data sources are clearly attributed and that the methodology is transparent and reproducible.
Limitations and Professional Considerations
No technology is without limitations, and responsible use of multispectral data in valuations requires awareness of the following:
- Temporal sensitivity — spectral indices vary with season, weather, and crop growth stage. A single flight provides a snapshot, not a definitive assessment. Multiple flights across a growing season are more reliable.
- Calibration dependency — uncalibrated data produces unreliable absolute values. Always confirm that a reflectance panel calibration was performed.
- Interpretation expertise — generating an NDVI map is straightforward; interpreting it correctly in the context of a specific soil type, crop, and climate requires specialist knowledge.
- Regulatory compliance — drone operations must comply with Civil Aviation Authority (CAA) regulations, including appropriate operator authorisation for the survey area.
- Evidential weight — multispectral data is supporting evidence, not a substitute for physical inspection, comparable analysis, or professional judgement. It strengthens a valuation report; it does not replace the surveyor's expertise.
For complex sites where multispectral findings raise questions about structural integrity or specific defects, a specific defect report may be warranted to investigate further.
Conclusion
The integration of multispectral sensors in drone surveys — revealing soil health and vegetation for 2026 property valuations — represents one of the most substantive advances in land assessment methodology of the past decade. For agricultural parcels, it provides objective, spatially precise evidence of productive capacity that supports or challenges comparable-based valuations. For development sites, it identifies drainage, contamination, and ecological constraints before they become costly surprises.
Actionable next steps for surveyors and land agents in 2026:
- Commission multispectral surveys early in the valuation process — ideally across at least two growing seasons for agricultural land.
- Require calibrated data and full processing outputs, not just visual maps.
- Work with agronomists or specialist data interpreters to translate index scores into valuation-relevant commentary.
- Integrate findings into formal reports as a documented technical appendix with clear methodology.
- Stay current with CAA regulatory requirements for commercial drone operations.
- For sites with complex ground conditions, combine multispectral findings with a subsidence survey or drainage survey to build a comprehensive evidence base.
Surveyors who embed this capability into their practice in 2026 will be better positioned to produce defensible, high-detail reports that meet the expectations of informed clients, lenders, and tribunals. The technology is proven, the costs are falling, and the competitive advantage of early adoption is real.
References
[1] Field Scanning – https://grow.airforce/field-scanning?utm_source=openai
[2] Sentera 6x Multispectral Sensor – https://harrisaerial.com/sentera-6x-multispectral-sensor/?utm_source=openai
[3] Multispectral Survey – https://www.sumoservices.com/multispectral-survey?utm_source=openai
[4] arxiv – https://arxiv.org/abs/2505.07840?utm_source=openai
[5] Soil Analysis – https://siora.ai/soil-analysis?utm_source=openai
[6] Multispectral Mapping – https://www.djdrone.co.uk/multispectral-mapping?utm_source=openai
[7] Agri Multispectral – https://www.airborneplatformsuk.com/agri-multispectral?utm_source=openai
[8] Multispec Eng – https://www.archaeodrones.com/index.php/multispec-eng?utm_source=openai
[9] Multispectral Uav Data Processing – https://www.igne.com/services/surveys/cad-and-data-processing-services/multispectral-uav-data-processing?utm_source=openai
[10] Hyperspectral – https://www.datapktaviation.com/hyperspectral.html?utm_source=openai