
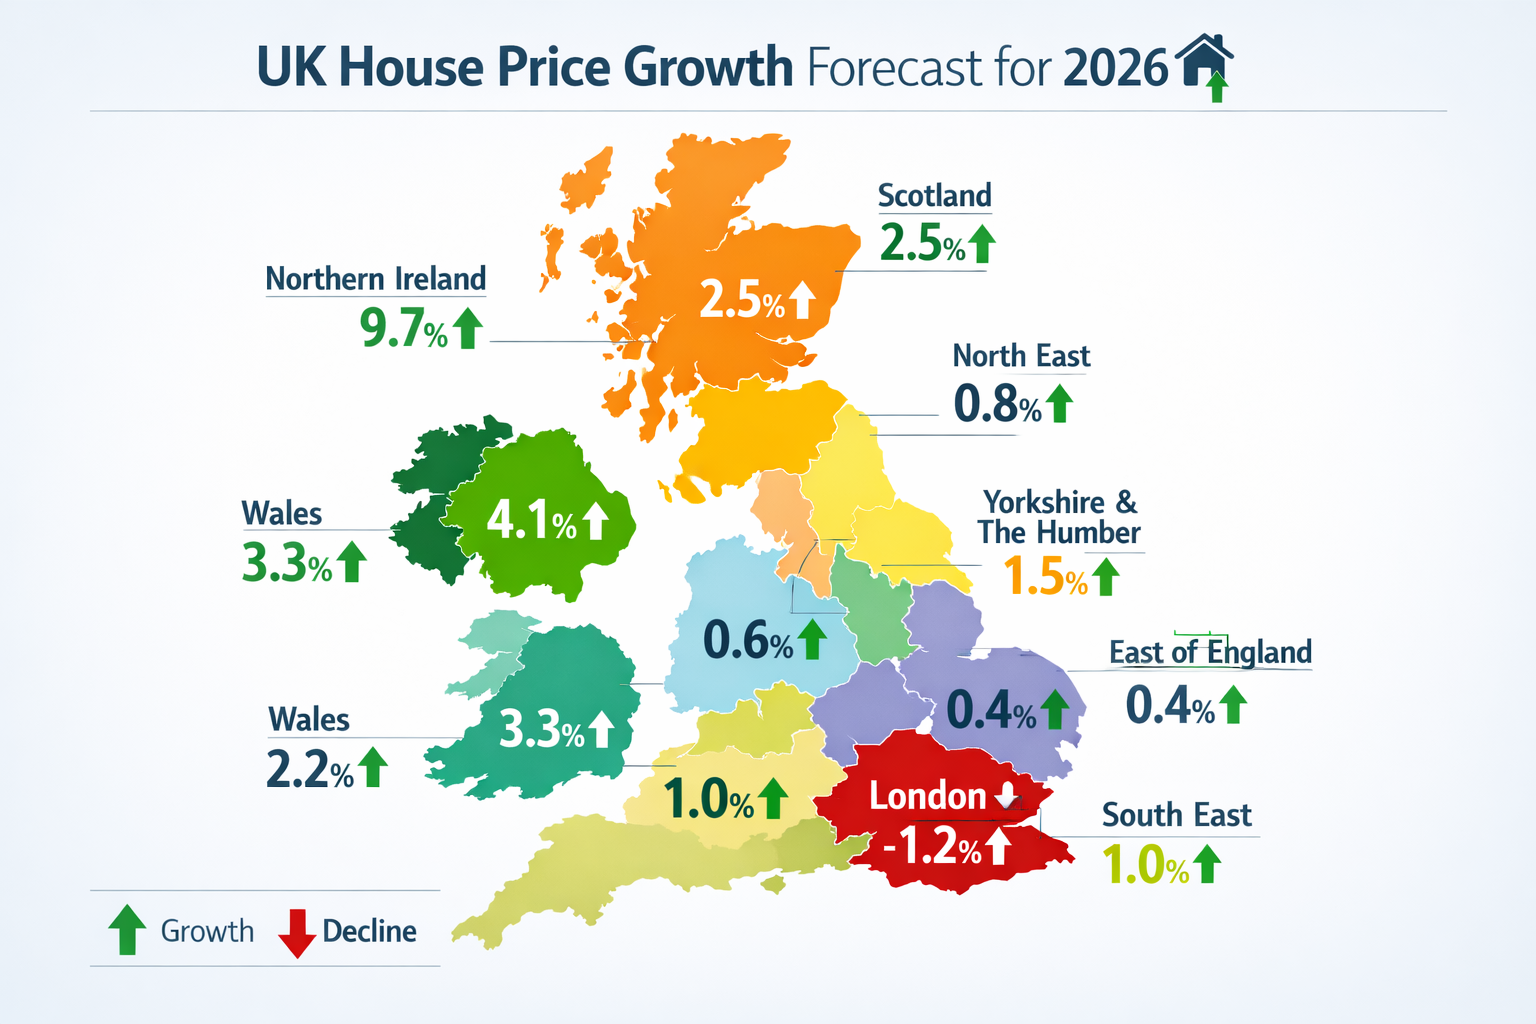
The UK property market in 2026 reveals a striking geographical divide that challenges traditional valuation approaches. Regional Valuation Divergences in 2026: North West England Survey Strategies Amid Widening Price Gaps represent more than statistical curiosities—they demand fundamental shifts in how chartered surveyors assess property values across different markets. With North West England achieving annual house price growth of 4.1% while London experiences a -1.2% decline, surveyors must adapt their methodologies to capture these dramatic regional variations accurately[1].
This widening gap creates both challenges and opportunities for property professionals, investors, and homebuyers navigating the 2026 market landscape.
Key Takeaways
- 📈 North West England leads UK growth with 4.1% annual house price increases, nearly double the 2.2% national average and four times the South East's 1.0% growth
- 🏢 London underperforms dramatically with -1.2% annual decline, creating the largest north-south valuation gap in recent history
- 🔍 Surveyors must adjust comparable analysis by incorporating regional growth differentials, local regeneration impacts, and supply constraints specific to northern markets
- 💼 Investment opportunities concentrate in North West cities like Preston, Lancaster, and Blackpool where regeneration and employment growth support sustained price resilience
- 📊 Valuation methodologies require regional customization including location-specific yield adjustments, demographic trend analysis, and infrastructure investment weighting
Understanding Regional Valuation Divergences in 2026
The North-South Divide Intensifies
The geographical split in UK property performance has reached unprecedented levels in 2026. Regional Valuation Divergences in 2026: North West England Survey Strategies Amid Widening Price Gaps reflect fundamental economic restructuring across Britain's regions.
The data paints a clear picture:
| Region | Annual Growth Rate | Average House Price |
|---|---|---|
| Northern Ireland | 9.7% | £185,000 (est.) |
| North West England | 4.1% | £216,741 |
| Yorkshire & Humber | 3.7% | £194,000 (est.) |
| National Average | 2.2% | £271,068 |
| South West | 1.9% | £295,000 (est.) |
| South East | 1.0% | £385,000 (est.) |
| East Anglia | -0.8% | £280,000 (est.) |
| London | -1.2% | £535,000 (est.) |
This divergence represents a 5.3 percentage point gap between North West growth and London's decline—a spread that fundamentally challenges standardized valuation approaches[1][2].
Paula Higgins, CEO of the HomeOwners Alliance, explicitly predicted this pattern would persist throughout 2026, stating: "We expect the current north-south divide in house price growth in England to persist with higher growth in the north of England than in the south"[1]. This authoritative forecast validates the need for region-specific surveying strategies.
Economic Drivers Behind Regional Divergences
Several interconnected factors explain why Regional Valuation Divergences in 2026: North West England Survey Strategies Amid Widening Price Gaps have emerged:
🏗️ Regeneration Investment
The North West continues benefiting from substantial regeneration projects, particularly in Morecambe, Lancaster, and Preston. These infrastructure improvements create sustained valuation support distinct to northern markets, supporting regional price resilience even when national sentiment weakens[3].
💰 Affordability Dynamics
With North West average prices at £216,741 compared to London's £535,000 (estimated), mortgage accessibility differs dramatically. Stabilized mortgage rates around 3.75%-4.75% have proportionally greater impact in lower-cost northern markets, where first-time buyers face reduced sensitivity to rate changes[3].
📍 Employment and University Influence
Cities including Preston, Lancaster, and Blackpool demonstrate strong employment growth and university influence that support local demand. Preston specifically has been identified as likely to outperform the UK average throughout 2026[3].
🏘️ Supply Constraints
Supply remains constrained in many northern areas, limiting downward price pressure despite softer national demand. This supply-demand imbalance creates upward valuation pressure that surveyors must incorporate into comparable adjustments[3].
For professionals conducting RICS valuations across multiple regions, these divergences require fundamentally different analytical frameworks.
Survey Strategies for North West England Valuations

Adapting Comparable Selection Methodology
Traditional comparable property analysis assumes relatively uniform market conditions. In 2026, this assumption fails spectacularly when Regional Valuation Divergences in 2026: North West England Survey Strategies Amid Widening Price Gaps create distinct micro-markets within short distances.
Key Adjustments for North West Comparables:
-
Temporal Weighting ⏰
- Prioritize comparables from the last 3-4 months rather than standard 6-month windows
- Apply time adjustments reflecting 4.1% annual growth (approximately 0.34% monthly)
- Discount older comparables more aggressively to capture accelerating growth
-
Geographical Precision 📍
- Narrow comparable radius to 0.5-1 mile in high-growth urban cores
- Distinguish between regeneration zones and peripheral areas
- Create separate comparable pools for Preston city center versus surrounding Lancashire towns
-
Property Type Differentiation 🏠
- First-time buyer properties (terraced, smaller semis) show stronger growth
- Luxury segment underperforms relative to regional averages
- New-build premiums compress as supply increases in specific developments
-
Infrastructure Proximity 🚆
- Properties near confirmed regeneration projects command 5-8% premiums
- University proximity (Lancaster, Preston) supports rental yield assumptions
- Transport link improvements create localized valuation uplift
When conducting freehold valuations in the North West, surveyors must document these adjustment factors explicitly to support defensible valuations.
Yield Model Adjustments for Investment Properties
Commercial and residential investment properties require distinct yield approaches when Regional Valuation Divergences in 2026: North West England Survey Strategies Amid Widening Price Gaps affect rental markets differently than capital values.
North West Yield Considerations:
Residential Investment 🏘️
- Gross yields typically 5.5-7.5% in North West versus 3.5-4.5% in London
- Strong rental demand from university populations supports yield stability
- First-time buyer competition reduces buy-to-let opportunities in entry-level segment
- Apply yield compression of 0.25-0.5% in high-growth areas to reflect capital appreciation expectations
Commercial Property 🏢
- Office yields reflect hybrid working patterns but stabilizing in regional cities
- Retail remains challenging except in regenerated town centers
- Industrial and logistics properties show strongest performance
- Valuation of commercial property requires sector-specific yield benchmarks
Yield Adjustment Formula:
Adjusted Yield = Base Regional Yield - (Growth Premium × 0.15) + Risk Factor
Where Growth Premium reflects the differential between regional and national growth rates, and Risk Factor incorporates local supply pipeline and economic indicators.
Incorporating Local Economic Indicators
Sophisticated North West valuations integrate forward-looking economic metrics:
Employment Trends 💼
- Preston's employment growth outpaces national averages
- Digital and creative sector expansion in Manchester influences commuter town values
- Public sector employment stability supports demand in administrative centers
Demographic Shifts 👥
- Migration from higher-cost southern regions accelerates
- Remote working enables lifestyle relocations to coastal areas (Blackpool, Morecambe)
- Student population growth supports specific micro-markets
Planning Pipeline 📋
- Approved residential developments indicate future supply pressure
- Commercial regeneration projects signal confidence and infrastructure investment
- Conservation area restrictions limit supply in historic centers
Surveyors conducting Manchester valuations must maintain databases tracking these indicators across different localities to support valuation adjustments.
Case Studies: Profitable Opportunities in Recovering Markets
Preston City Center Regeneration Play
Property Type: Victorian terraced conversion (3 flats)
Purchase Price: £185,000 (Q1 2025)
Current Valuation: £198,500 (Q1 2026)
Appreciation: 7.3% (12 months)
Surveyor Strategy:
The initial valuation incorporated Preston's confirmed regeneration investment and employment growth projections. Comparables were adjusted +3% for proximity to university and +2% for regeneration zone location. The surveyor's report explicitly noted that standard regional growth assumptions (4.1%) understated likely appreciation for this specific micro-location.
Outcome:
Actual appreciation exceeded regional averages by 3.2 percentage points, validating the location-specific adjustments. The property now generates 6.8% gross yield with strong capital growth prospects.
Key Lesson: 🎯 Granular location analysis within high-growth regions identifies outperformance opportunities that broad regional metrics miss.
Lancaster Student Housing Investment
Property Type: Purpose-built student accommodation (6-bed HMO)
Purchase Price: £295,000 (Q2 2025)
Current Valuation: £308,000 (Q1 2026)
Appreciation: 4.4% (9 months)
Surveyor Strategy:
The valuation emphasized Lancaster University's expansion plans and constrained student housing supply. Yield analysis incorporated both rental income stability and capital growth potential. The surveyor applied compressed yields (5.2% versus 6.0% market norm) to reflect growth expectations and institutional investor interest.
Outcome:
Full occupancy maintained throughout academic year with 3.5% rental increase for 2026-27. Capital appreciation tracked regional growth with additional premium for purpose-built student specification.
Key Lesson: 🎓 Institutional-grade properties in supply-constrained university towns justify yield compression and premium valuations versus comparable residential investments.
Blackpool Coastal Regeneration Opportunity
Property Type: Seafront apartment (2-bed)
Purchase Price: £125,000 (Q4 2024)
Current Valuation: £132,000 (Q1 2026)
Appreciation: 5.6% (15 months)
Surveyor Strategy:
Initial valuation acknowledged Blackpool's mixed reputation but weighted regeneration investment and improving tourism infrastructure heavily. Comparables from previous 12 months were adjusted upward +4% to reflect accelerating improvement trajectory. The surveyor identified this as a "recovery market" where sentiment lagged fundamentals.
Outcome:
Coastal regeneration projects delivered ahead of schedule, improving local amenities and perception. Property appreciated faster than regional averages as sentiment caught up with physical improvements.
Key Lesson: 🌊 Recovery markets with confirmed infrastructure investment offer asymmetric opportunities where current valuations don't fully price in improvement trajectories.
For professionals seeking similar opportunities, working with experienced chartered surveyors who understand local market nuances proves essential.
Advanced Valuation Techniques for Divergent Markets

Multi-Scenario Modeling
When Regional Valuation Divergences in 2026: North West England Survey Strategies Amid Widening Price Gaps create uncertainty, sophisticated surveyors employ scenario-based valuations:
Scenario Framework:
-
Base Case (60% probability)
- North West growth continues at 3.5-4.5% annually
- National growth stabilizes at 2.0-2.5%
- Mortgage rates remain 3.75-4.75%
- Regeneration projects deliver on schedule
-
Optimistic Case (20% probability)
- North West growth accelerates to 5.0-6.0%
- Southern stagnation drives additional northern migration
- Interest rate cuts to 3.25-4.00% boost affordability
- Major infrastructure announcements (HS2 extensions, transport upgrades)
-
Pessimistic Case (20% probability)
- Regional growth slows to 1.5-2.5%
- Economic downturn affects employment
- Mortgage rates rise to 5.0-5.5%
- Regeneration delays or cancellations
Weighted Valuation Calculation:
Final Valuation = (Base × 0.60) + (Optimistic × 0.20) + (Pessimistic × 0.20)
This approach provides clients with valuation ranges rather than false precision, acknowledging market uncertainties while maintaining professional rigor.
Hedonic Pricing Models for Regional Adjustments
Advanced surveyors apply hedonic regression analysis to quantify specific attribute values across different regions:
Key Variables in North West Models:
- Location Attributes: Distance to city center, regeneration zone (yes/no), coastal proximity
- Property Characteristics: Period features, energy efficiency rating, parking availability
- Economic Factors: Local employment growth rate, average household income, university proximity
- Supply Dynamics: Planning approvals within 1km, new-build competition, conservation restrictions
Hedonic models reveal that identical properties in different North West locations can vary 15-25% based purely on micro-location factors—far exceeding traditional adjustment ranges.
For commercial property surveying applications, these models prove particularly valuable in quantifying location premiums.
Risk-Adjusted Valuation Frameworks
Investment valuations must incorporate regional risk differentials:
North West Risk Factors:
✅ Lower Risks:
- Affordability supports demand resilience
- Diversified employment base reduces sector concentration
- Regeneration investment provides downside protection
- Lower absolute prices limit potential percentage declines
⚠️ Higher Risks:
- Economic dependency on specific employers or sectors
- Regeneration project execution uncertainty
- Smaller transaction volumes reduce liquidity
- Less institutional investor interest versus London
Risk Adjustment Application:
Risk-Adjusted Value = Market Value × (1 - Regional Risk Premium)

Where Regional Risk Premium = 0.02-0.05 for North West
versus 0.01-0.03 for London (despite current underperformance)
This counterintuitive approach recognizes that London's liquidity and institutional depth provide risk mitigation despite current price weakness.
Regulatory Compliance and Professional Standards
RICS Red Book Requirements
The RICS Valuation – Global Standards (Red Book) mandates specific considerations when Regional Valuation Divergences in 2026: North West England Survey Strategies Amid Widening Price Gaps affect valuation certainty:
Material Uncertainty Clauses ⚖️
Surveyors must consider whether regional divergences constitute "material uncertainty" requiring explicit disclosure. While 2026 regional variations are substantial, they represent market fundamentals rather than temporary disruptions (unlike COVID-19 pandemic conditions).
Comparable Evidence Standards 📊
Red Book requires "sufficient, relevant and reliable comparable evidence." In rapidly appreciating North West markets, this demands:
- Explicit temporal adjustments with supporting calculations
- Documentation of comparable selection criteria
- Justification for excluding older or geographically distant comparables
- Sensitivity analysis showing valuation ranges
Assumptions and Special Assumptions 📝
Regional valuations often require special assumptions regarding:
- Future regeneration project completion
- Planning permission likelihood for development sites
- Rental growth assumptions in student markets
- Infrastructure improvement timelines
Professionals conducting RICS Help to Buy valuations must ensure regional adjustments comply with scheme-specific requirements.
Documentation and Audit Trails
Defensible valuations in divergent markets require comprehensive documentation:
Essential Documentation:
- Comparable Selection Matrix showing all potential comparables and exclusion rationale
- Adjustment Calculations with explicit formulas and supporting data
- Regional Market Analysis incorporating economic indicators and growth forecasts
- Risk Assessment documenting regional-specific factors
- Sensitivity Analysis showing valuation ranges under different assumptions
This documentation proves essential for mortgage lender acceptance, tribunal proceedings, and professional indemnity claims.
Cross-Regional Consistency
Firms operating across multiple regions face challenges maintaining consistency while adapting to local conditions. Best practices include:
Standardized Frameworks with Regional Parameters 🔧
- Core methodology remains consistent
- Regional adjustment factors updated quarterly
- Peer review by surveyors familiar with specific markets
- Centralized database of regional economic indicators
Quality Assurance Processes ✅
- Second surveyor review for valuations exceeding thresholds
- Statistical analysis identifying outlier valuations
- Regular calibration against actual transaction prices
- Continuous professional development focused on regional markets
Firms specializing in structural surveys across regions must ensure technical assessments inform valuation adjustments appropriately.
Future Outlook: Sustaining Regional Strategies
Predicted Market Evolution Through 2026-2027
Current indicators suggest Regional Valuation Divergences in 2026: North West England Survey Strategies Amid Widening Price Gaps will persist but potentially moderate:
Base Case Forecast (2026-2027):
- North West growth moderates to 2.5-3.5% as base effects diminish
- London stabilizes with modest 0-1% growth as affordability improves
- National average converges toward 1.5-2.5% range
- Regional gap narrows but remains substantial at 2-3 percentage points
Key Monitoring Indicators: 📈
- Mortgage rate trajectory – Further cuts boost affordability disproportionately in North West
- Migration patterns – Remote working trends sustaining northern relocations
- Regeneration delivery – Infrastructure project completion versus delays
- Employment trends – Regional job growth differentials
- Supply pipeline – Planning approvals and construction starts by region
Surveyors must maintain flexible methodologies that adapt as regional dynamics evolve.
Technology Integration for Regional Analysis
Advanced surveying practices increasingly leverage technology for regional market analysis:
Data Analytics Platforms 💻
- Real-time comparable property databases with automated adjustments
- Machine learning models predicting micro-location premiums
- Economic indicator dashboards tracking regional employment, demographics
- Automated valuation models (AVMs) providing initial range estimates
Geographic Information Systems (GIS) 🗺️
- Spatial analysis identifying regeneration impact zones
- Heat mapping showing price growth patterns
- Infrastructure proximity calculations
- Planning application tracking and visualization
Market Intelligence Tools 📱
- Sentiment analysis from property portal data
- Transaction volume tracking by micro-location
- Rental yield monitoring across property types
- Investor activity indicators
These technologies enhance rather than replace professional judgment, providing data-driven support for regional adjustment decisions.
Professional Development Priorities
Surveyors navigating regional divergences require specialized knowledge:
Essential Competencies:
- Regional Economics – Understanding local employment, demographics, infrastructure
- Statistical Analysis – Hedonic modeling, regression analysis, scenario planning
- Investment Analysis – Yield calculations, risk assessment, portfolio strategy
- Regulatory Knowledge – Red Book compliance, lender requirements, scheme-specific rules
Continuous professional development through RICS courses, regional market seminars, and peer knowledge sharing maintains expertise as markets evolve.
For those seeking expert guidance, consulting with RICS-certified chartered building surveyors ensures valuations reflect both professional standards and local market realities.
Conclusion
Regional Valuation Divergences in 2026: North West England Survey Strategies Amid Widening Price Gaps represent a fundamental shift in UK property markets that demands sophisticated, adaptive surveying approaches. With North West England achieving 4.1% annual growth while London experiences -1.2% decline, the 5.3 percentage point gap between regions creates both challenges and opportunities for property professionals[1][2].
Key Strategic Imperatives:
🎯 Adapt Comparable Methodologies – Narrow geographical and temporal parameters, apply explicit adjustments for regeneration zones and infrastructure proximity, and document selection criteria comprehensively.
📊 Incorporate Regional Economic Indicators – Track employment growth, demographic shifts, regeneration project delivery, and supply pipeline developments to inform forward-looking valuations.
💼 Identify Asymmetric Opportunities – Focus on recovery markets where sentiment lags fundamentals, supply-constrained university towns, and regeneration zones with confirmed infrastructure investment.
⚖️ Maintain Professional Standards – Ensure Red Book compliance, create robust documentation and audit trails, and apply consistent frameworks with regional parameters.
🔮 Monitor Evolving Dynamics – Track mortgage rates, migration patterns, regeneration delivery, and employment trends to adapt strategies as regional divergences evolve.
Actionable Next Steps
For property investors, homebuyers, and professionals navigating these divergent markets:
-
Engage Regional Specialists – Work with chartered surveyors demonstrating deep knowledge of specific North West micro-markets rather than generalist national firms.
-
Request Scenario Analysis – Ask for valuation ranges under different assumptions rather than single-point estimates to understand uncertainty.
-
Verify Comparable Adjustments – Review how surveyors adjust for temporal changes, location differences, and property characteristics to ensure rigor.
-
Consider Forward Indicators – Evaluate regeneration pipelines, employment trends, and infrastructure investments alongside current pricing.
-
Maintain Flexibility – Recognize that regional dynamics evolve, requiring periodic revaluation and strategy adjustment.
The widening regional gaps in 2026 create a more complex but potentially more rewarding property landscape. Success requires combining professional expertise, local market knowledge, and adaptive strategies that recognize the UK no longer functions as a single, unified property market. By implementing the survey strategies and analytical frameworks outlined above, property professionals can navigate these divergences confidently while identifying opportunities others overlook.
For comprehensive valuation services that incorporate these regional strategies, consider consulting with experienced professionals who understand both national standards and local market nuances. The future belongs to those who recognize that in 2026's divergent markets, location matters more than ever—and professional expertise matters most of all.
References
[1] House Price Forecast – https://hoa.org.uk/advice/guides-for-homeowners/i-am-buying/house-price-forecast/
[2] Uk Property Market Forecast For 2026 What Buyers Should Expect – https://www.farrellheyworth.co.uk/blog/uk-property-market-forecast-for-2026-what-buyers-should-expect/
[3] House Prices Start 2026 On A Cautious Note What Buyers Should Know – https://arnoldandbaldwin.co.uk/insights/house-prices-start-2026-on-a-cautious-note-what-buyers-should-know