
The UK property market in 2026 tells two dramatically different stories. While Northern Ireland celebrates growth rates approaching 10% and the North East of England experiences its strongest performance in years, London property owners face declining values and stagnant markets. This stark regional divergence in property valuations creates unprecedented challenges for surveyors who must now adjust their building survey findings to account for widening North-South price gaps that traditional valuation methods struggle to capture.
Understanding Regional Divergence in Property Valuations: How Surveyors Should Adjust Building Survey Findings for North-South Price Gaps in 2026 has become essential for chartered surveyors, property professionals, and investors navigating today's fragmented market. The conventional approach of applying national averages or historical comparables no longer provides accurate valuations when regional markets move in opposite directions.
Key Takeaways
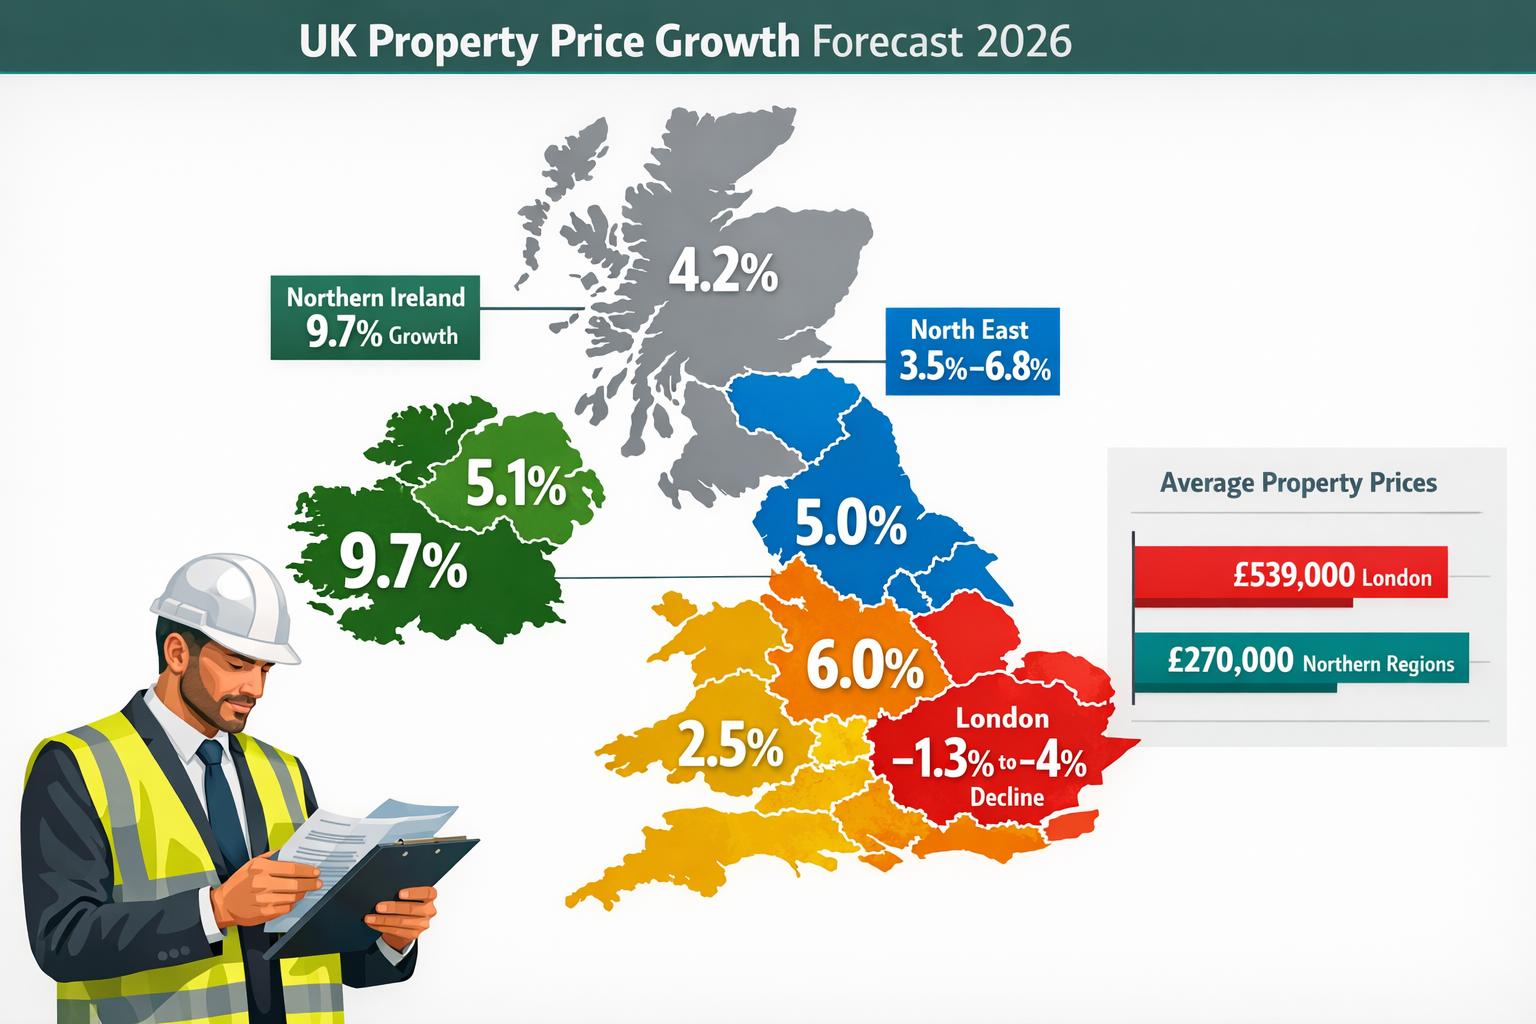
- Northern regions are significantly outperforming southern markets, with the North East achieving 3.5-6.8% annual growth while London experiences declines of 1.3-4% [1][2]
- Surveyors must apply region-specific adjustment factors to building survey valuations, accounting for local market velocity, affordability constraints, and supply-demand imbalances
- London flat valuations average £539,000—more than double northern England prices—requiring substantial percentage adjustments when comparing similar property types across regions [1]
- Supply levels vary dramatically by region, with London inventory up 16% year-on-year versus tighter northern markets, necessitating different valuation approaches [4]
- Five-year mortgage rate improvements below 4% disproportionately benefit affordable northern markets compared to already-constrained southern regions [4]
Understanding the 2026 Regional Property Market Landscape
The North-South Divide in Numbers
The UK housing market entered 2026 with the most pronounced regional disparities in recent memory. Northern Ireland achieved the strongest UK growth in 2025 at 9.7%, though prices remain approximately 5% below their 2007 peak [1]. This contrasts sharply with UK-wide prices that stand nearly 50% higher than 2007 levels, highlighting how different regions recovered from the financial crisis at vastly different rates.
The North East is experiencing England's strongest growth at 3.5-6.8% annually [1][2], creating compelling investment opportunities and valuation challenges. Meanwhile, London prices declined 1.3% to 2.4-4% in 2025, making it one of the weakest performing regions and the only major UK area experiencing price stagnation or falls as of early 2026 [1][3].
These figures represent more than statistical curiosities—they fundamentally alter how surveyors must approach RICS valuation assignments across different regions.
Regional Performance Breakdown
| Region | 2025 Growth Rate | Average Property Value | Market Trend |
|---|---|---|---|
| Northern Ireland | +9.7% | £180,000 | 🔥 Strong Growth |
| North East England | +3.5% to +6.8% | £195,000 | 📈 Rising |
| Yorkshire & Humber | +4.2% | £225,000 | 📈 Rising |
| Scotland | +3.8% | £210,000 | 📈 Rising |
| West of England | +1.9% | £340,000 | ➡️ Stable Growth |
| London | -1.3% to -4% | £539,000 | 📉 Declining |
| South East | -0.5% to -1.2% | £425,000 | 📉 Weak |
The West of England (South West region) saw average property value growth of 1.9% year-on-year, with Forest of Dean leading at 7.9%, followed by South Gloucestershire at 3.5% and Bath and North East Somerset at 2.3% [4]. This demonstrates that even within broader regions, micro-market variations require surveyor attention.
Property Type Performance Variations
Semi-detached homes were the best-performing property type in 2025 with 2.4% year-on-year price growth [1], compared to just 0.6% UK average. Flats have significantly underperformed with only 18% gains over the past decade versus 41% for terraced houses [1].
This property-type divergence compounds regional variations. London flat valuations average £539,000, more than double the average prices in Scotland, Wales, Northern Ireland, and northern England [1], representing a critical adjustment factor for surveyors comparing comparable properties across regions.
For surveyors conducting homebuyer surveys or comprehensive RICS building surveys, these property-type considerations must layer onto regional adjustments to produce accurate valuations.
Core Factors Driving Regional Divergence in Property Valuations
Affordability Constraints and Price Sensitivity
Affordability constraints are significantly more binding in higher-priced southern England markets [3], with higher stock levels and greater price sensitivity creating downward pressure compared to more affordable northern regions. This fundamental economic principle creates a ceiling effect in expensive markets while allowing continued growth in affordable areas.
When mortgage rates improved in late 2025 and early 2026, with five-year fixed mortgage rates falling to 3.95%—the first time below 4% since September 2022 [4], the impact varied dramatically by region. In northern markets where average property values sit around £200,000, this rate reduction meaningfully improved buyer purchasing power. In London where average values exceed £500,000, the same rate reduction provided insufficient relief to overcome affordability barriers.
Surveyors must recognize that identical percentage changes in financing costs produce different valuation impacts depending on absolute price levels. A chartered surveyor in Central London faces different market dynamics than colleagues working in northern regions.
Supply and Demand Imbalances
The UK housing market began 2026 with the highest level of homes for sale in over eight years, with average agents marketing 32 properties [4]. However, this national figure masks dramatic regional variations in inventory levels.
Supply increases have been most pronounced in southern England, with London inventory up 16% year-on-year and the South East up 9% [4], contributing to downward valuation pressure in these regions. Northern markets have experienced more modest inventory increases or, in some micro-markets, continued supply constraints.
The widening gap between asking prices and achieved prices is concentrated in higher-priced southern markets [3], meaning surveyors should apply greater percentage reductions to valuations in London and the South East compared to northern regions where asking prices more closely align with transaction prices.
This supply-demand dynamic directly impacts how surveyors should adjust comparable evidence. Properties in South West London or Hammersmith require different comparable adjustments than similar properties in northern markets.
Economic and Employment Factors
Regional employment patterns, wage growth, and economic diversification create underlying support or headwinds for property values. Northern regions benefiting from infrastructure investment, business relocation, and improved connectivity have experienced stronger fundamentals supporting price growth.
London's traditional economic advantages—higher wages, diverse employment, and international appeal—have been partially offset by remote work trends, cost-of-living pressures, and lifestyle migration to more affordable regions. These structural shifts suggest the regional divergence may persist beyond short-term market cycles.

Regional Divergence in Property Valuations: How Surveyors Should Adjust Building Survey Findings for North-South Price Gaps in 2026
Establishing Regional Adjustment Frameworks
Professional surveyors must develop systematic approaches to adjust building survey findings for regional price gaps. This requires moving beyond simple comparable selection to implementing regional adjustment multipliers that account for market velocity, supply conditions, and affordability constraints.
Step 1: Identify the Base Regional Market
Begin every valuation by clearly establishing which regional market applies. UK house prices averaged £271,000 as of early 2026 [1], but this national figure provides little guidance for specific properties. Regional variations range from over £6,000/m² in London to approximately £1,800/m² in northern areas [1], creating substantial adjustment parameters.
For properties in transitional areas or commuter zones, surveyors must determine whether the property trades in the higher-priced or lower-priced regional market based on buyer demographics, transport links, and local comparable evidence.
Step 2: Apply Market Velocity Adjustments
Market velocity—the speed at which prices are changing—varies dramatically by region and must inform valuation adjustments:
High-Growth Northern Markets (3.5%+ annual growth):
- Apply positive time adjustments when using older comparables
- Weight recent transactions more heavily
- Consider forward-looking value appreciation in reinstatement calculations
- Recognize that asking prices may understate achievable values
Declining Southern Markets (-1% to -4% annual change):
- Apply negative time adjustments for older comparables
- Scrutinize asking prices as potentially optimistic
- Weight achieved prices over asking prices
- Consider downward trajectory in mortgage valuation contexts
A surveyor conducting a mortgage valuation in London must recognize that a comparable from six months ago may overstate current value by 1-2%, while the same time lag in the North East might understate value by 2-3%.
Step 3: Adjust for Property Type Performance Differentials
Layer property-type adjustments onto regional factors. The 2.4% growth for semi-detached properties versus 0.6% overall average [1] means that:
- Semi-detached properties in northern markets may warrant premium adjustments combining regional and property-type factors
- Flats in southern markets face compounding negative factors requiring substantial downward adjustments
- Terraced houses show more consistent performance across regions, requiring smaller regional adjustments
Practical Adjustment Methodologies
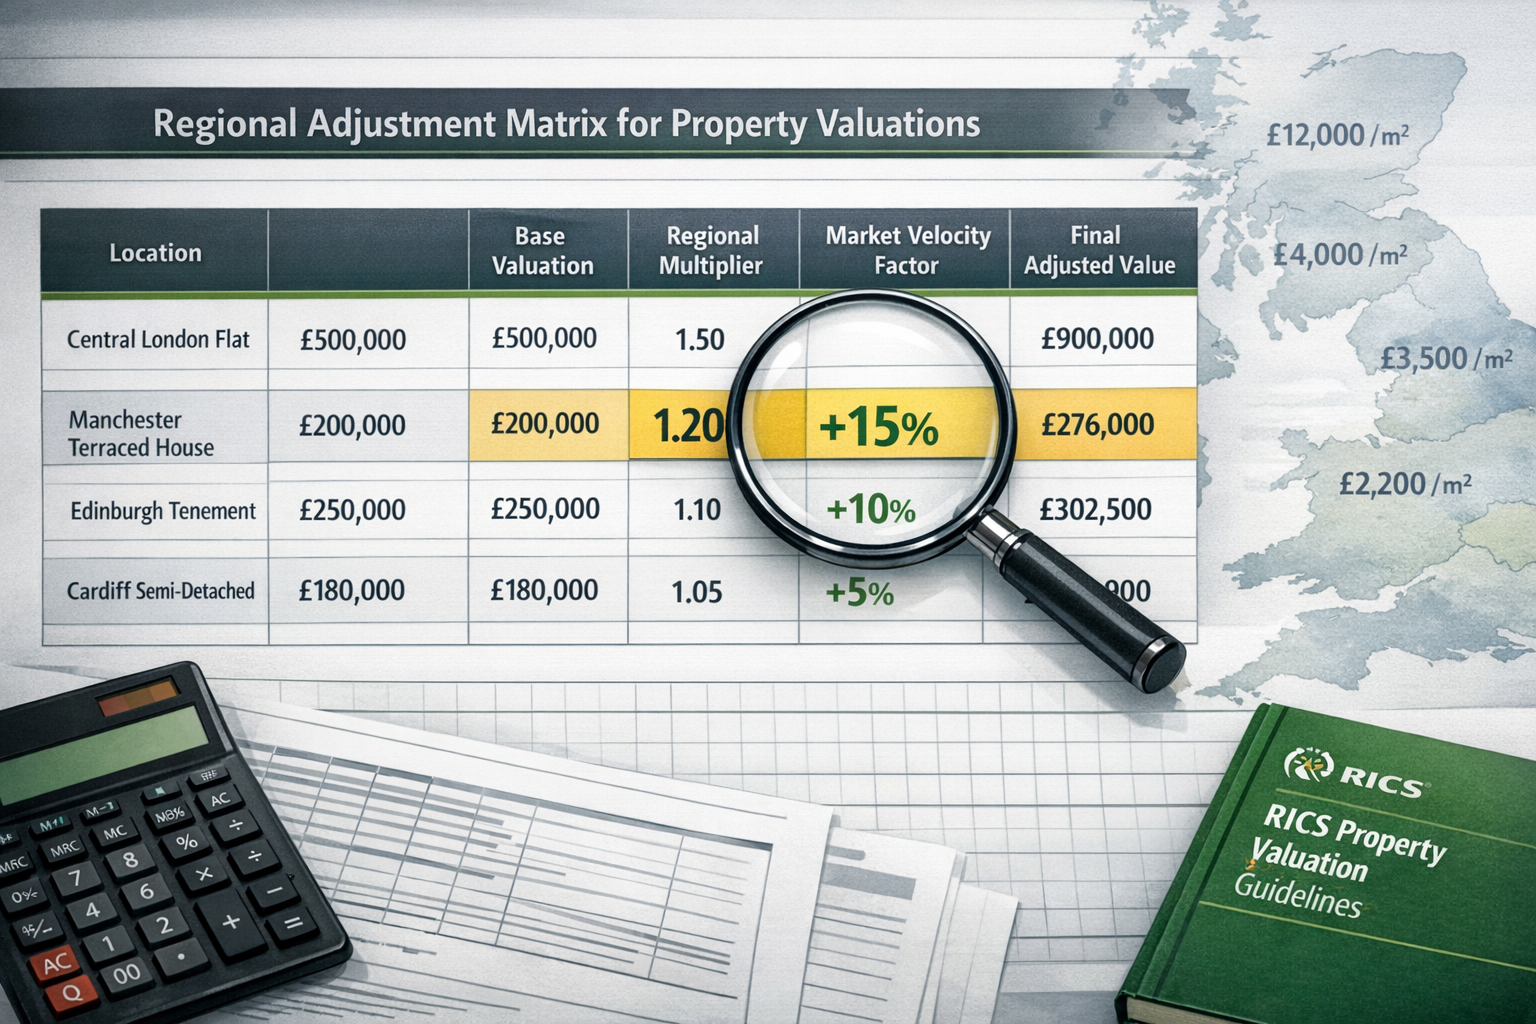
Comparable Evidence Adjustment Matrix
Create a structured adjustment matrix for each valuation:
Base Comparable Value: £X
Regional Market Adjustment: +/- Y%
Property Type Adjustment: +/- Z%
Time Adjustment (Market Velocity): +/- A%
Supply Condition Adjustment: +/- B%
= Adjusted Comparable Value
Example Application – London Flat:
Base Comparable Value: £550,000
Regional Market Adjustment: -3% (declining market)
Property Type Adjustment: -2% (flat underperformance)
Time Adjustment: -1.5% (6-month comparable in declining market)
Supply Condition Adjustment: -2% (excess inventory)
= Adjusted Value: £502,500
Example Application – North East Semi-Detached:
Base Comparable Value: £200,000
Regional Market Adjustment: +5% (strong growth market)
Property Type Adjustment: +2% (semi-detached outperformance)
Time Adjustment: +2.5% (6-month comparable in rising market)
Supply Condition Adjustment: +1% (tight inventory)
= Adjusted Value: £221,000
Geographic Adjustment Zones
Establish clear geographic zones with standardized adjustment parameters:
Zone 1 – High-Growth Northern Markets:
- North East England, Northern Ireland, parts of Yorkshire
- Base adjustment: +3% to +7% annually
- Comparable time decay: +0.5% per month for older comparables
- Supply premium: +1% to +2% in tight inventory areas
Zone 2 – Moderate-Growth Midlands and Regional Cities:
- Parts of West Midlands, East Midlands, regional centers
- Base adjustment: +1% to +3% annually
- Comparable time decay: +0.2% per month
- Supply neutral: 0% to +1%
Zone 3 – Stable Southern Markets Outside London:
- Parts of South West, South East commuter zones
- Base adjustment: -0.5% to +1.5% annually
- Comparable time decay: minimal
- Supply pressure: -1% to 0%
Zone 4 – Declining London and Prime South East:
- Central London, prime Home Counties
- Base adjustment: -2% to -4% annually
- Comparable time decay: -0.3% to -0.5% per month
- Supply pressure: -2% to -3%
Adjusting Building Survey Findings for Regional Context
When conducting comprehensive building surveys, surveyors must adjust their findings and recommendations based on regional market conditions:
Repair Cost Recommendations
In declining southern markets:
- Emphasize immediate repairs that prevent further deterioration
- Highlight defects that significantly impact marketability
- Recommend addressing cosmetic issues that may deter buyers in oversupplied markets
- Consider that deferred maintenance has greater negative impact on value
In strong northern markets:
- Prioritize structural and safety-critical repairs
- Note that cosmetic defects have minimal impact on strong buyer demand
- Recognize that buyers may accept properties needing work due to limited inventory
- Consider that minor defects have less proportional impact on value
Reinstatement Cost Assessments
Reinstatement valuations for insurance purposes must account for regional construction cost variations. While rebuild costs don't vary as dramatically as property values, regional factors include:
- Labor cost variations (higher in London and South East)
- Material transportation costs (higher in remote areas)
- Availability of specialist trades (varies by region)
- Planning and regulatory complexity (generally higher in conservation areas, more common in southern regions)
Advanced Considerations for Regional Divergence in Property Valuations
Micro-Market Analysis Within Regions
Broad regional classifications provide starting points, but sophisticated surveyors must recognize micro-market variations within regions. The West of England data showing Forest of Dean at 7.9% growth versus Bath at 2.3% [4] demonstrates that regional averages mask significant local variations.
Surveyors should:
✅ Maintain local comparable databases organized by specific postcodes and neighborhoods
✅ Track micro-market inventory levels rather than relying solely on regional data
✅ Identify local economic drivers such as new employers, infrastructure projects, or school catchment changes
✅ Monitor planning applications and development pipelines that may alter supply-demand balance
Future-Proofing Valuations
Yorkshire and the Humber, the North East, and Scotland are forecast to achieve cumulative gains of 25-30% over 2026-2030 [1], versus approximately 22% UK-wide and weaker southern performance. While surveyors must value properties at current market levels, understanding trajectory helps inform:
- Investment valuations and development appraisals
- Long-term lease valuations
- Portfolio valuations for institutional clients
- Strategic advice to clients on timing of purchases or sales
Cross-Regional Portfolio Valuations
For clients with property portfolios spanning multiple regions, surveyors must:
- Apply region-specific methodologies to each property rather than portfolio-wide averages
- Weight regional adjustments based on the specific location of each asset
- Recognize correlation risks where regional divergence may continue or reverse
- Provide scenario analysis showing portfolio values under different regional performance assumptions
Regulatory and Professional Standards
RICS Red Book valuation standards require surveyors to use appropriate methods and assumptions. When addressing Regional Divergence in Property Valuations: How Surveyors Should Adjust Building Survey Findings for North-South Price Gaps in 2026, professionals must:
- Document regional adjustment methodologies clearly in valuation reports
- Provide evidence supporting regional factors through market data and analysis
- Disclose uncertainty where regional trends may be volatile or reversing
- Maintain professional skepticism about extrapolating short-term trends
- Update market knowledge continuously as regional performance evolves
Chartered surveyors and valuers must balance standardized professional approaches with the flexibility to adapt to unprecedented regional divergence.
Practical Implementation for Surveyors
Data Sources and Market Intelligence
Effective regional adjustment requires robust data sources:
📊 Land Registry Price Paid Data – Track actual transaction prices by region and property type
📊 Rightmove and Zoopla Market Reports – Monitor asking prices, time on market, and inventory levels
📊 RICS Residential Market Survey – Access professional sentiment and forward-looking indicators
📊 Local Estate Agent Intelligence – Gather on-the-ground insights about buyer demand and pricing
📊 Mortgage Lender Data – Understand financing availability and buyer affordability by region
Technology and Valuation Tools
Modern surveyors should leverage technology to implement regional adjustments:
- Automated Valuation Models (AVMs) with regional calibration
- GIS mapping tools to visualize price gradients and regional boundaries
- Database systems that flag regional adjustment requirements
- Comparable analysis software with built-in regional adjustment factors
Client Communication
Explaining regional adjustments to clients requires clear communication:
"Your property is located in a region currently experiencing [growth/decline] of approximately X% annually, compared to the UK average of Y%. This regional performance significantly impacts valuation and requires adjustments to comparable evidence from different time periods or locations."
Provide clients with:
- Clear explanations of why regional adjustments matter
- Comparative data showing their region versus others
- Transparent methodology for how adjustments were calculated
- Context about whether regional trends may continue or reverse
Conclusion
The stark regional divergence in UK property valuations during 2026 represents both a challenge and an opportunity for professional surveyors. With Northern Ireland achieving 9.7% growth while London experiences declines of up to 4%, traditional valuation approaches that assume relatively uniform national markets no longer provide accurate assessments.
Regional Divergence in Property Valuations: How Surveyors Should Adjust Building Survey Findings for North-South Price Gaps in 2026 requires surveyors to implement systematic regional adjustment frameworks, maintain detailed local market knowledge, and clearly communicate methodologies to clients and stakeholders.
The key principles for surveyors navigating this landscape include:
🎯 Recognize that regional factors now outweigh national trends in determining property values
🎯 Implement structured adjustment matrices that account for market velocity, supply conditions, and affordability constraints
🎯 Maintain granular local market knowledge beyond broad regional classifications
🎯 Document methodologies clearly to meet professional standards and client expectations
🎯 Update market intelligence continuously as regional performance evolves
Actionable Next Steps
For surveyors seeking to improve their regional valuation capabilities:
- Audit your current comparable databases to ensure adequate regional coverage and recent transactions
- Establish regional adjustment protocols with documented methodologies and approval processes
- Invest in continuing professional development focused on regional market analysis and valuation techniques
- Build relationships with local market participants including estate agents, developers, and fellow surveyors in different regions
- Review recent valuations to assess whether regional adjustments were adequate and accurate
- Implement quality control processes that specifically check for appropriate regional adjustments
The property professionals who master regional divergence analysis will provide superior value to clients, maintain competitive advantages, and uphold the highest standards of the surveying profession in an increasingly fragmented market landscape. Whether conducting RICS building surveys or Red Book valuations, regional adjustment expertise has become an essential competency for 2026 and beyond.
References
[1] Uk Price Forecasts – https://investropa.com/blogs/news/uk-price-forecasts
[2] Valuation Divergence North Vs South Uk House Prices In 2026 And Surveyor Adjustment Techniques – https://nottinghillsurveyors.com/blog/valuation-divergence-north-vs-south-uk-house-prices-in-2026-and-surveyor-adjustment-techniques
[3] Watch – https://www.youtube.com/watch?v=QNEZeLc3THs
[4] Regional Property Market Update Spring 2026 West Of England South West – https://www.stevegooch.co.uk/blog-box-view/1454924560/1772633316/regional-property-market-update-spring-2026-west-of-england-south-west?from_page=%2Fnews&post_width=contained