
For the first time in over a decade, the housing market is experiencing a fundamental shift that property professionals cannot ignore. Wage growth is finally outpacing house price growth across two-thirds of counties, marking what experts call the "Great Housing Reset" of 2026 [3]. This reversal creates both opportunities and challenges for property valuers who must now assess genuine affordability improvements against years of market sentiment shaped by rapidly escalating prices.
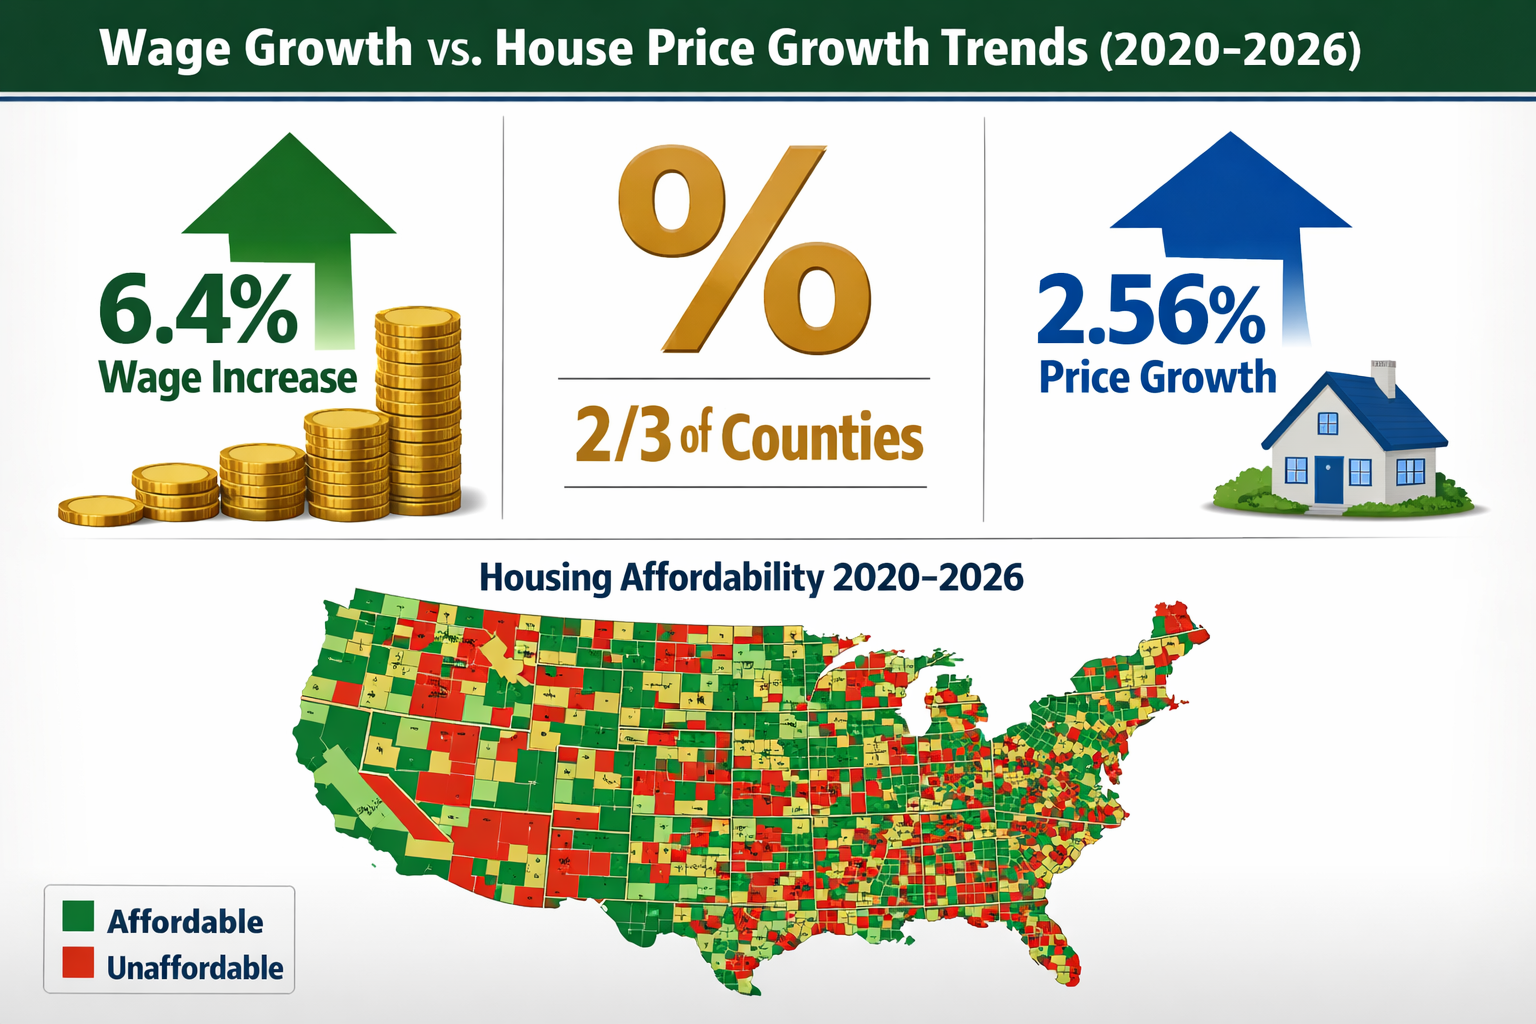
Valuation Surveys for 2026 Improved Affordability: Capturing Wage Growth Outpacing House Price Growth represent a critical tool for understanding this market transformation. As average wages increased by 6.4% while median home prices rose just 2.56% in the first quarter of 2026, professional valuers need robust frameworks to document these changes accurately [3]. The implications extend far beyond simple price adjustments—they affect mortgage lending decisions, investment strategies, and long-term market forecasts.
Key Takeaways
- 💰 Wage growth outpaced house price growth in approximately two-thirds of U.S. counties during 2025-2026, reversing a trend that persisted since 2011
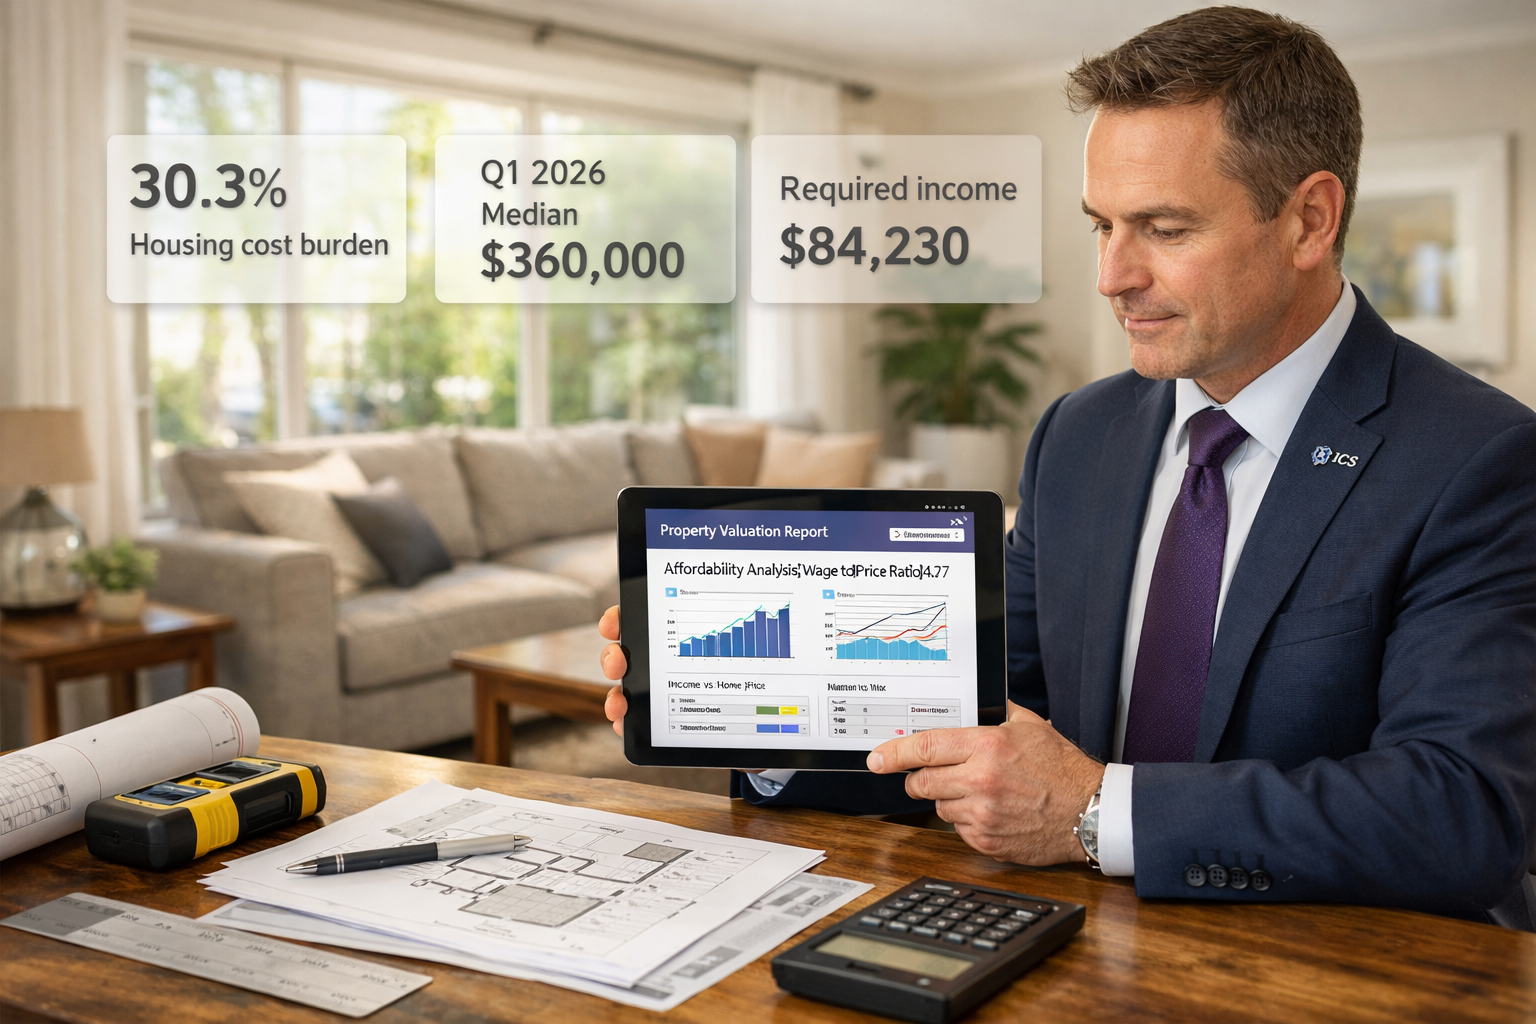
- 📊 The national affordability threshold dropped from $86,611 to $84,230 annually for purchasing a median-priced home in Q1 2026—the first improvement in years
- 🏘️ Housing cost burden decreased to 30.3% of typical wages in Q1 2026, down from 31.6% a year earlier, with fewer counties classified as "seriously unaffordable"
- 📈 Median home prices reached $360,000 nationally in Q1 2026, representing modest 2.56% annual growth compared to 6.4% wage increases
- 🔍 Professional valuers must adapt their assessment frameworks to capture this affordability shift while accounting for regional variations and persistent challenges in high-cost markets
Understanding the 2026 Housing Affordability Shift
The housing market dynamics of 2026 represent a watershed moment for property valuation professionals. After years of house prices surging ahead of income growth, the relationship between earnings and home values has fundamentally recalibrated [3]. This shift didn't happen overnight—it reflects the convergence of several economic factors that valuers must understand to provide accurate assessments.
The Numbers Behind the Affordability Improvement
In the first quarter of 2026, the median home price reached $360,000, up just 2.56% from $351,000 in Q1 2025 [3]. Meanwhile, average weekly wages climbed 6.4% over the same period [3]. This represents the widest positive gap between wage growth and price appreciation since the Great Recession era.
The practical impact is significant: a buyer now needs to earn $84,230 annually to afford a median-priced home with a 20% down payment while keeping monthly housing expenses below 28% of wages—down from $86,611 the previous year [3]. This marks the first time this affordability threshold has decreased rather than increased in recent memory.
| Metric | Q1 2025 | Q1 2026 | Change |
|---|---|---|---|
| Median Home Price | $351,000 | $360,000 | +2.56% |
| Required Annual Income | $86,611 | $84,230 | -2.75% |
| Housing Cost Burden | 31.6% | 30.3% | -1.3 percentage points |
| Wage Growth (annual) | N/A | 6.4% | N/A |
Geographic Variations in Affordability Improvements
The affordability improvement isn't uniform across all markets. Wage growth outpaced house price growth in approximately two-thirds of counties analyzed [3], but the remaining third continues to experience affordability challenges. This geographic variation creates complexity for valuers conducting comparative market analyses.
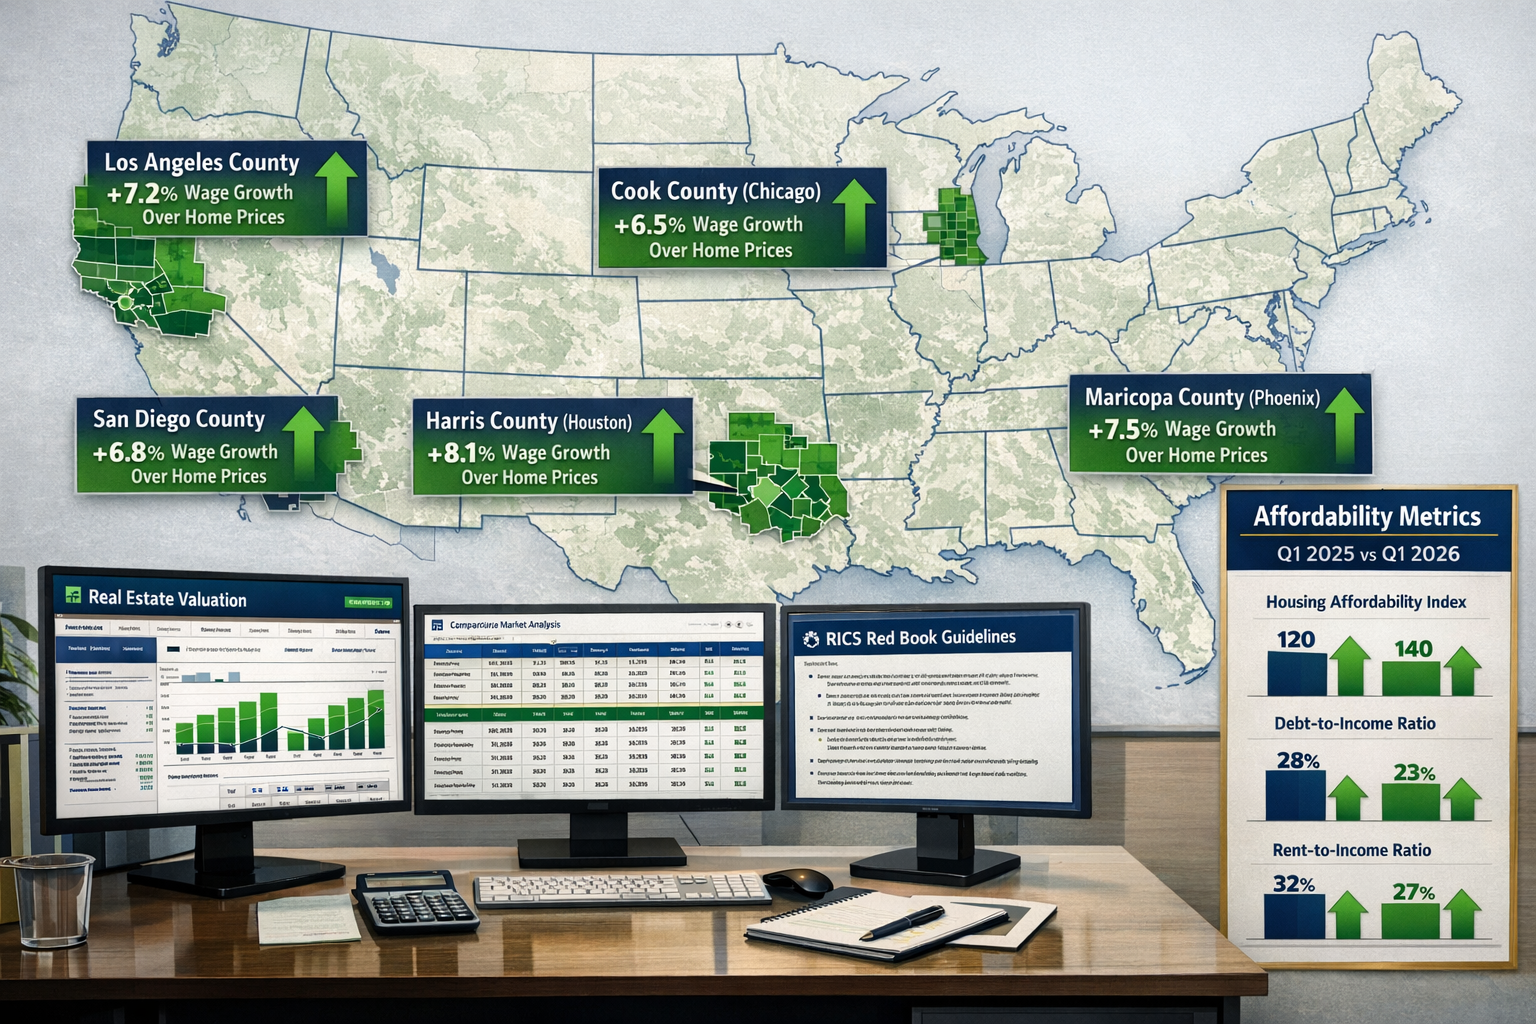
Major metropolitan counties experiencing improved affordability include:
- Los Angeles County, California 🌴
- Cook County, Illinois (Chicago)
- Harris County, Texas (Houston)
- Maricopa County, Arizona (Phoenix)
- San Diego County, California
These populous counties demonstrate that even traditionally expensive markets are experiencing the wage-price recalibration [3]. For property professionals conducting RICS valuations, understanding these regional patterns is essential for accurate market positioning.
The "Seriously Unaffordable" Threshold
Housing affordability researchers classify markets as "seriously unaffordable" when monthly housing expenses exceed 43% of typical residents' wages. In Q1 2026, nearly 25% of counties analyzed fell into this category—down substantially from nearly 30% in the previous quarter [3].
California continues to dominate the list of most unaffordable markets, claiming 14 of the 25 counties with the greatest housing cost burden. New York had four counties, New Jersey three, and Hawaii two [3]. These persistently challenging markets require specialized valuation approaches that account for structural supply constraints and high regional cost of living.
Valuation Surveys for 2026 Improved Affordability: Professional Assessment Frameworks
Professional valuers must adapt their methodologies to capture the 2026 affordability shift accurately. Traditional valuation approaches focused primarily on comparable sales and replacement cost may miss critical affordability indicators that now drive market behavior. Valuation Surveys for 2026 Improved Affordability: Capturing Wage Growth Outpacing House Price Growth require integrated frameworks that combine multiple data sources.
Key Components of Affordability-Focused Valuations
Modern property valuations must incorporate several new dimensions:
1. Wage-to-Price Ratio Analysis 📊
Valuers should calculate the median home price-to-median income ratio for the specific county or metropolitan area. A declining ratio indicates improving affordability and may support higher transaction volumes even with stable prices.
2. Housing Cost Burden Calculations
Determine what percentage of typical local wages would be consumed by mortgage payments, property taxes, insurance, and mortgage insurance for the subject property. Compare this to the 28% conventional threshold and the 43% "seriously unaffordable" benchmark [3].
3. Regional Wage Growth Trends
Access Bureau of Labor Statistics data on average weekly wage growth for the specific region. Markets where wages are growing 4-6% annually while prices increase 2-3% demonstrate fundamentally different dynamics than markets with inverse relationships [2][3].
4. Mortgage Rate Environment
Current mortgage rates significantly impact affordability calculations. With rates settling in the low 6% range for 2026 (down from a 2025 average of 6.6%), monthly payment calculations must reflect this improved borrowing environment [2][3].
Integrating RICS Red Book Standards with Affordability Metrics
The RICS Red Book provides the foundational standards for property valuation, but valuers must supplement these guidelines with affordability-specific considerations. When conducting valuations for mortgage lending, investment analysis, or market studies, consider these additional factors:
- Market absorption rates in relation to local wage levels
- First-time buyer accessibility based on income distribution data
- Rental yield comparisons to ownership costs
- Historical affordability cycles for the specific market
For specialized assessments such as Help to Buy valuations or Shared Ownership valuations, the improved affordability environment may expand the eligible buyer pool, affecting demand projections and value conclusions.
Data Sources for Comprehensive Affordability Analysis
Professional valuers should leverage multiple authoritative data sources:
- Bureau of Labor Statistics (BLS) for wage data by county and metropolitan area
- Federal Housing Finance Agency (FHFA) House Price Index for price trend analysis
- Local Multiple Listing Services (MLS) for transaction volume and days-on-market trends
- Census Bureau American Community Survey for income distribution data
- Mortgage Bankers Association for current lending rate information
When conducting factors of valuation analysis, these data sources provide the empirical foundation for adjusting comparable sales and projecting future market conditions.
Regional Market Analysis: Where Valuation Surveys for 2026 Improved Affordability Matter Most
The 2026 affordability improvement manifests differently across regional markets, creating distinct valuation challenges and opportunities. Understanding these geographic patterns helps valuers provide context-appropriate assessments that reflect local market realities rather than national averages.
High-Growth Markets with Improving Affordability
Several major metropolitan areas demonstrate the most dramatic affordability improvements:
Houston (Harris County, Texas) 🏙️
Houston's combination of robust wage growth in energy and technology sectors with relatively modest home price appreciation creates one of the nation's most improved affordability profiles. Valuers working in this market should emphasize transaction volume trends and first-time buyer activity as key value indicators.
Phoenix (Maricopa County, Arizona)
After years of rapid price appreciation, Phoenix has seen prices stabilize while wages continue climbing. The market shift from seller-dominated to more balanced conditions requires valuers to adjust their comparable selection timeframes and weigh recent transactions more heavily.
Chicago (Cook County, Illinois)
Chicago's wage growth, driven by financial services and professional services sectors, has outpaced its relatively flat home price trajectory. Valuers should account for neighborhood-level variations, as some submarkets show stronger improvement than others.
Persistently Challenging Markets
Despite national affordability improvements, certain markets remain structurally constrained:
California Coastal Counties 🌊
Los Angeles and San Diego counties show improved affordability metrics, but both remain in the "seriously unaffordable" category with housing costs exceeding 40% of typical wages [3]. Valuers in these markets must carefully document the disconnect between local incomes and property values, particularly for lending-related valuations.
New York Metropolitan Area
Four New York counties rank among the nation's most unaffordable markets [3]. Supply constraints, zoning restrictions, and high construction costs continue to limit affordability improvements despite wage growth. Valuers should emphasize replacement cost analysis and land value components in these markets.
Hawaii
With two counties in the top 25 most unaffordable markets [3], Hawaii's geographic isolation and limited developable land create unique valuation challenges. Professional assessments must account for the structural nature of affordability constraints rather than treating them as temporary market conditions.
Emerging Opportunities in Secondary Markets
The affordability shift is creating opportunities in previously overlooked secondary markets:
- Suburban counties surrounding major metros are seeing increased buyer interest
- Mid-sized cities with strong employment bases are attracting relocating buyers
- Remote-work-friendly locations continue benefiting from pandemic-era migration patterns
For valuers conducting structural surveys or comprehensive property assessments in these emerging markets, the improved affordability environment may justify higher value conclusions than historical data alone would suggest.
The Millennial and Gen Z Homeownership Challenge
Despite improved national affordability metrics, homeownership rates for Gen Z and millennials plateaued in 2024 with no improvement expected in 2026 [2]. Just over one-quarter of Gen Zers owned homes, while 54.9% of millennials held homeownership in 2024 [2].
This stagnation reflects several persistent challenges:
- Student debt burdens limiting down payment savings
- Delayed household formation affecting first-time buyer timing
- Preference for urban locations where affordability remains constrained
- Alternative living arrangements with approximately 6% of affordability-challenged Americans moving back with parents or taking on roommates [2]
Valuers should consider these demographic trends when assessing demand for entry-level properties and projecting absorption rates for new construction developments.
Practical Applications for Property Professionals
The 2026 affordability shift has concrete implications for various valuation contexts:
Mortgage Lending Valuations
Lenders increasingly request affordability-focused valuations that assess whether property values align with local income levels. When conducting mortgage valuations, include:
- Income-to-value ratio analysis for the subject property
- Comparison to county median wage and price relationships
- Affordability trend direction (improving or deteriorating)
- Projected payment burden at current mortgage rates
These additions help lenders assess not just current market value but also the sustainability of that value given local economic conditions.
Investment Property Analysis
For investors evaluating rental properties or development opportunities, the improved affordability environment affects:
- Rental demand projections (as more buyers can afford to purchase, rental demand may soften)
- Price appreciation forecasts (modest 1-2% annual growth expected [2])
- Exit strategy timing (improved affordability may expand the buyer pool)
- Development feasibility (construction costs versus achievable sales prices)
Professional valuers conducting insurance reinstatement valuations should also consider how improved affordability affects rebuild cost justification and replacement value calculations.
Estate and Tax Valuations
For valuation for probate or capital gains tax purposes, the 2026 affordability shift may affect:
- Marketability assessments (improved affordability typically increases liquidity)
- Comparable selection (recent sales may show different patterns than older transactions)
- Holding period recommendations (whether to sell immediately or wait for further market evolution)
Right to Buy and Shared Ownership Schemes
Government-supported homeownership programs benefit significantly from improved affordability. When conducting Right to Buy valuations, valuers should document how wage growth relative to prices expands the eligible buyer pool and supports program objectives.
Future Outlook: Sustaining the Affordability Improvement
The critical question for property professionals is whether the 2026 affordability improvement represents a temporary market adjustment or a sustained structural shift. Several factors will determine the trajectory:
Factors Supporting Continued Improvement
Wage Growth Momentum 💪
If wage growth maintains its 4-6% annual pace while home price appreciation remains modest at 1-2% [2], affordability will continue improving through 2027 and beyond. Labor market strength and productivity gains support this scenario.
Mortgage Rate Stabilization
Rates settling in the low 6% range [2][3] provide a more predictable borrowing environment than the volatility experienced in 2023-2024. Stable rates support both buyer confidence and valuer forecasting accuracy.
Increased Housing Supply
Some markets are seeing accelerated construction and development activity. If supply increases continue, price pressure should remain modest even as demand recovers.
Risks to Affordability Gains
Economic Recession 📉
A significant economic downturn could reverse wage growth trends while potentially causing home prices to decline. Valuers should monitor leading economic indicators for early warning signs.
Inflation Resurgence
If inflation accelerates, mortgage rates could rise above the 6% range, eroding affordability gains despite wage increases. The geopolitical shock that pushed rates above 6.4% in late February 2026 [3] demonstrates this vulnerability.
Supply Constraints
In structurally constrained markets (California coastal areas, New York metro, Hawaii), supply limitations may prevent affordability improvements regardless of wage growth.
Implications for Valuation Practice
Professional valuers should adopt a dynamic, data-driven approach that regularly updates affordability metrics rather than relying on static assumptions. Consider implementing:
- Quarterly affordability reviews for markets where you regularly work
- Wage growth monitoring through BLS data subscriptions
- Mortgage rate tracking from multiple sources
- Transaction volume analysis to detect demand shifts early
For those conducting comprehensive property assessments, integrating which survey do you need guidance with affordability considerations helps clients understand both property condition and market positioning.
Conclusion
Valuation Surveys for 2026 Improved Affordability: Capturing Wage Growth Outpacing House Price Growth represent more than a technical adjustment to valuation methodology—they reflect a fundamental market transformation that property professionals must understand and document accurately. After over a decade of house prices outpacing wage growth, the 2026 reversal creates both opportunities and complexities for valuers across all specializations.
The data tells a compelling story: wage growth of 6.4% versus home price growth of 2.56% in Q1 2026 [3], affordability thresholds declining for the first time in years, and two-thirds of counties experiencing improved wage-to-price ratios [3]. These metrics signal that the "Great Housing Reset" forecast by industry experts is indeed underway [2].
Actionable Next Steps for Property Professionals
For Valuers:
- Update your valuation templates to include affordability metrics alongside traditional comparable sales analysis
- Subscribe to regional wage data from the Bureau of Labor Statistics for markets where you regularly work
- Develop county-specific affordability profiles that track wage growth, price trends, and housing cost burden over time
- Integrate mortgage rate scenarios into your valuation reports to show sensitivity to financing conditions
For Lenders and Investors:
- Request affordability-focused valuations that go beyond simple market value conclusions
- Monitor regional variations rather than relying solely on national trends
- Adjust underwriting criteria to account for improved affordability in qualifying borrowers
- Reassess portfolio risk in light of changing wage-to-price relationships
For Homebuyers and Sellers:
- Understand local affordability trends in your specific county or metropolitan area
- Consider timing decisions based on whether your market is improving or lagging national trends
- Engage professional valuers who understand the 2026 affordability shift and can provide context-appropriate assessments
The improved affordability environment of 2026 doesn't erase the challenges of the past decade, particularly for younger generations still struggling with homeownership access. However, it does represent a meaningful shift toward more sustainable housing market dynamics where wage growth and home values move in closer alignment.
Professional valuers who adapt their frameworks to capture this shift—integrating wage data, affordability calculations, and regional analysis into their standard practice—will provide superior value to clients navigating this transformed market landscape. The fundamentals of property valuation remain unchanged, but the context in which we apply those fundamentals has evolved significantly.
As we progress through 2026 and beyond, continued monitoring of the wage-price relationship will be essential. The sustainability of current affordability improvements depends on economic factors that remain uncertain. What is certain is that property professionals who understand and document these dynamics will be best positioned to serve their clients effectively in this new market era.
References
[1] Housing Vs Wages – https://usafacts.org/articles/housing-vs-wages/
[2] Housing Reset Income Growth Home Price Growth 2026 Redfin – https://fortune.com/2025/12/06/housing-reset-income-growth-home-price-growth-2026-redfin/
[3] Home Affordability Improves In First Quarter As Wages Rise Home Price Growth Softens – https://www.scotsmanguide.com/news/home-affordability-improves-in-first-quarter-as-wages-rise-home-price-growth-softens/
[5] When Houses Outrun Paychecks Lost Decades Housing Affordability – https://www.stlouisfed.org/on-the-economy/2026/feb/when-houses-outrun-paychecks-lost-decades-housing-affordability
[6] Home Prices Continue Outpace Wages Keeping Affordability Under Pressure – https://nationalmortgageprofessional.com/news/home-prices-continue-outpace-wages-keeping-affordability-under-pressure
[7] Home Prices Surge Five Times Median Income Nearing Historic Highs – https://www.jchs.harvard.edu/blog/home-prices-surge-five-times-median-income-nearing-historic-highs